
Figures & data
Figure 1 Study design.
Abbreviations: GP, general practice; EOS, eosinophil; ICS, inhaled corticosteroids.
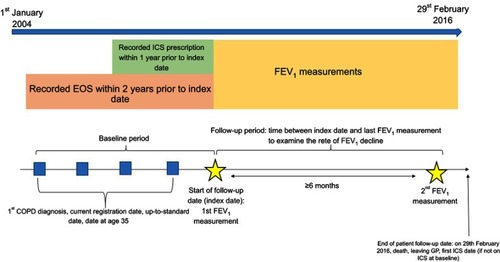
Table 1 Reference and comparison patient groups
Table 2 Sample size needed to detect a difference in rates of change of FEV1 between ICS and non-ICS groups of patients
Table 3 Baseline characteristics for all included patients (N=26,675). Values are n (%) or median (IQR)
Table 4 Medication prescribed in the year prior to start of follow-up by baseline ICS use. Values are n (%)
Figure 2 Flow diagram of included patients.
Abbreviation: ICS, inhaled corticosteroids.
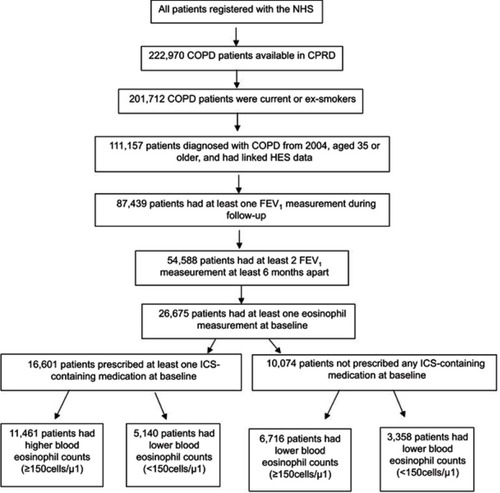
Table 5 Rates of change of FEV1 by blood eosinophil/ICS group in prevalent ICS cohort
Table 6 Rates of change of FEV1 by blood eosinophil/ICS group in incident ICS cohort