Figures & data
Table 1 Baseline demographics and clinical characteristics
Figure 1 Mean ± SD plasma concentration–time profiles for revefenacin (A) and THRX-195518 (B) in subjects with and without severe renal impairment (n=8 per group).
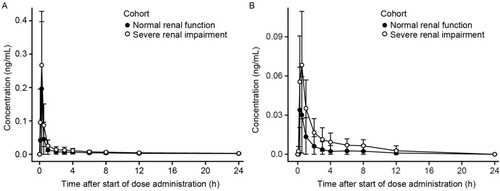
Table 2 Plasma and urine PK parameters (arithmetic mean [SD]) for revefenacin and THRX-195518 in renal impairment study
Figure 2 Comparison of Cmax (A) and AUCinfa (B) for revefenacin and THRX-195518 between cohorts with normal and severely impaired renal function.
Abbreviations: AUCinf, area under the concentration–time curve from time 0 to infinity; Cmax, maximum observed plasma concentration.
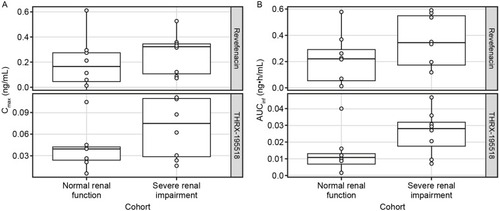
Figure 3 Scatter plots of revefenacin Cmax (A) and AUCinfa (B) versus eGFR. Cmax (C) and AUCinfa (D) versus CLcr in the renal impairment study.
Abbreviations: AUCinf, area under the concentration–time curve from time 0 to infinity; CI, confidence interval; CLcr, creatinine clearance; Cmax, maximum observed plasma concentration; eGFR, estimated glomerular filtration rate; PK, pharmacokinetic.
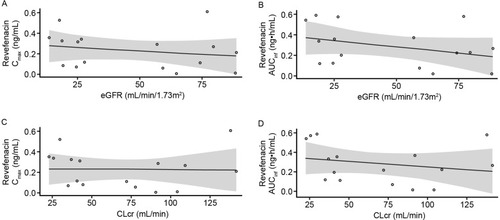
Figure 4 Scatter plots of THRX-195518 Cmax (A) and AUCinfa (B) versus eGFR. Cmax (C) and AUCinfa (D) versus CLcr in the renal impairment study.
Abbreviations: AUCinf, area under the concentration–time curve from time 0 to infinity; CI, confidence interval; CLcr, creatinine clearance; Cmax, maximum observed plasma concentration; eGFR, estimated glomerular filtration rate; PK, pharmacokinetic.
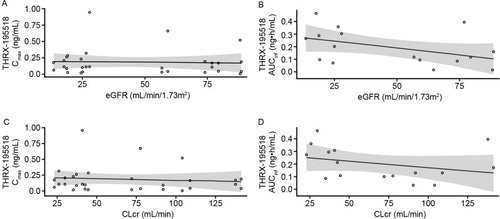
Table 3 Plasma and urine PK parameters (arithmetic mean [SD]) for revefenacin and THRX-195518 in hepatic impairment study
Figure 5 Mean ± SD plasma concentration-time profiles for revefenacin (A) and THRX-195518 (B) in subjects with and without moderate hepatic impairment (n=8 per group).
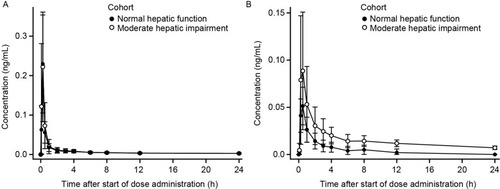
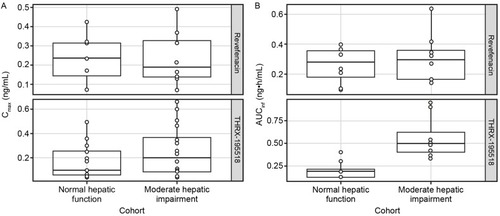
Figure 6 Comparison of Cmax (A) and AUCinfa (B) for revefenacin and THRX-195518 between cohorts with normal and moderately impaired hepatic function.
Abbreviations: AUCinf, area under the concentration–time curve from time 0 to infinity; Cmax, maximum observed plasma concentration; PK, pharmacokinetic.