Figures & data
Table 1 Characteristics of study subjects
Table 2 Detailed distribution of HAV and LAV divided into respective percentage and peel/core subgroups
Figure 1 Distribution of HAV and LAV in full IN and full EX.
Abbreviations: TOT, whole lung; CORE, central lung areas; PEEL, peripheral lung areas; HAV, high attenuation volume; LAV, low attenuation volume; IN, full inspiration; EX, full expiration.
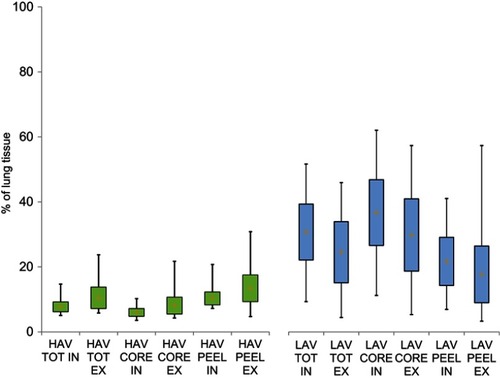
Table 3 Results of multivariate and simple regression analysis before and after application of bronchodilators
Figure 2 Correlation of HAV andLAV with forced expiratory volume in 1 second, percent of predicted (FEV1%) in different lung volumes and breathhold series. All lung function tests were performed without prior bronchospasmolysis. In full expiration, more than 88% of the lung parenchyma in peripheral lung areas accounted for HAV (second row on the right). Even in this situation, solely LAV showed a significant negative correlation with FEV1% and HAV did not (LAV: r=−0.312, R2=0.097, p=0.027; HAV: p=0.587).
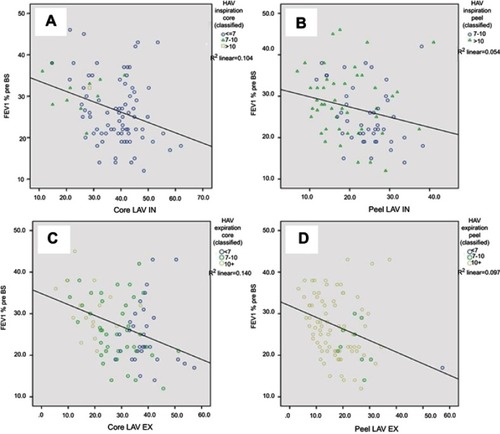
Table 4 Subgroup analyses
Table 5 Independent contributions of LAV and HAV
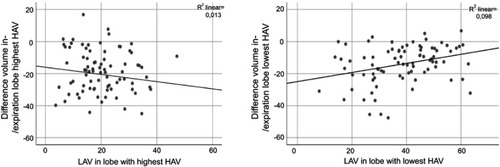
Figure 3 Correlation of LAV with volume difference between ex- and inspiration in pulmonary lobes with the highest and lowest percentage of HAV, respectively. Only with a low proportion of fibrotic patterns low attenuation volumes seem to statistically significantly reduce the volume difference (as a measure of elasticity or air trapping) in the affected lobe (see right functional graph); LAV´s Pearson´s r=0.313, R2=0.098, p=0.0004; HAV: p=0.572). In pulmonary lobes with high HAV, no significant correlation between LAV and the volume difference could be demonstrated. On the contrary, the relationship seems to at least tend to be inverse (see left functional graph); LAV´s Pearson´s r=−0.112, R2=0.013, p=0.312; HAV: p=0.836).