
Figures & data
Table 1 Descriptive tobacco-related measures among waterpipe (WP), cigarette and non-smokers
Table 2 Descriptive lifestyle and academic characteristics of the sample (column percentages reported)
Figure 1 Proportions reporting each respiratory symptom across waterpipe smokers (WP), cigarette smokers (CS), and non-smokers (NS).
Notes: Please see separate image. *p-value for chi-square statistic comparing waterpipe smokers to non-smokers or cigarette smokers to non-smokers <0.015 (significance cut-off for Šidák-Holm adjusted p-value). ¶p-value for chi-square statistic comparing waterpipe smokers to cigarette smokers <0.015. §p-value for chi-square statistic comparing waterpipe smokers to cigarette smokers <0.05 but >0.015. ǂp-value for chi-square statistic comparing cigarette smokers to non-smokers <0.016; p-value for chi-square statistic comparing waterpipe smokers to non-smokers <0.05 but >0.016.
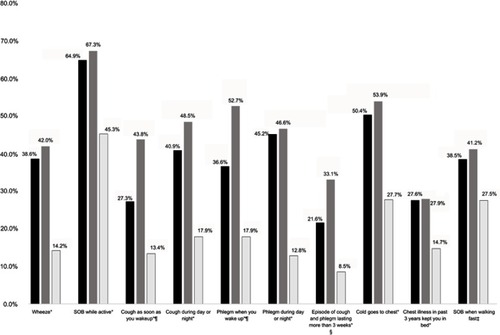
Table 3 Multivariable negative binomial regression model of count of respiratory symptoms in waterpipe smokers (WP), cigarette smokers (CS) compared to non-smokers (incidence rate ratios presented)
Table 4 Quality of life mean scores reported by waterpipe smokers (WP), cigarette smokers (CS) and non-smokers (NS)