Figures & data
Table 1 Characteristics of the subjects
Figure 1 (A) Scores plots of OPLS-DA model separating COPD and asthma–COPD overlap (ACO) (R2Y =0.81, Q2=0.79); (B) Scores plots of OPLS-DA model separating healthy control and ACO (R2Y =0.84, Q2=0.81); (C) 3D-Plot of OPLS-DA model separating healthy control, COPD and ACO.
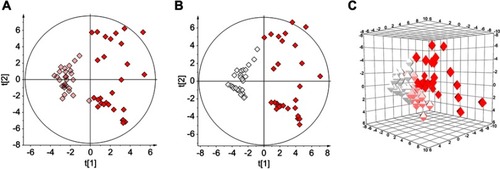
Figure 2 Heatmap analysis of eicosanoids levels in serum of healthy control, COPD, and asthma–COPD overlap (ACO).
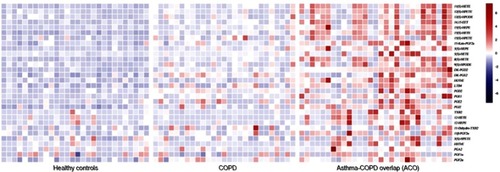
Figure 3 Spring-embedded correlation plot illustrating the relationship between eicosanoids and clinical parameters.
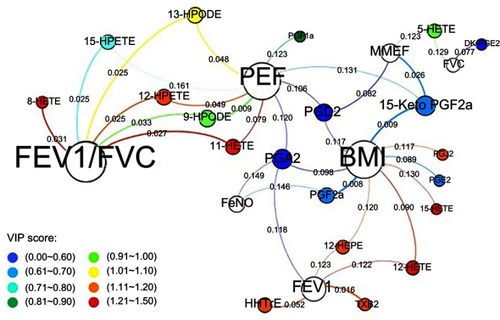
Figure 4 Proposed metabolic pathway of the relevant eicosanoids. White column: healthy control (HC) group; pink column: COPD group; red column: asthma–COPD overlap (ACO) group. #, significantly compared with healthy control; $, significantly compared with COPD.
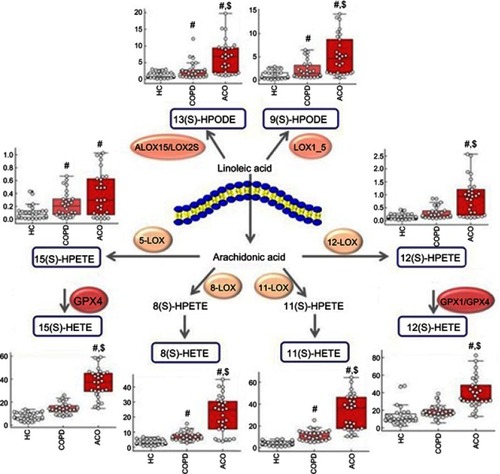
Table 2 Identification and selection of metabolites between ACO and COPD
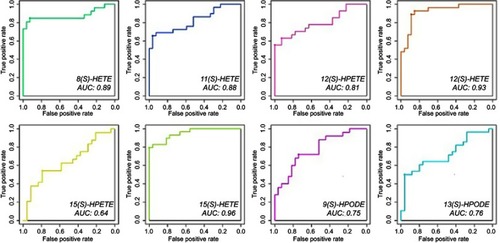
Figure 5 Receiver operating characteristic (ROC) curves of relevant eicosanoids.