
Figures & data
Figure 1 Reconstructed chest CT scan in COPD patient. This image was acquired with high-spatial-frequency algorithm reconstruction using fully automated Pulmo3D software (Siemens, Munich, Germany). Low attenuation area (LAA%) was derived from the voxel frequency distribution histogram and represented the percentage of lung voxels less than −950 HU. In this COPD patient, LAA value was 23%.
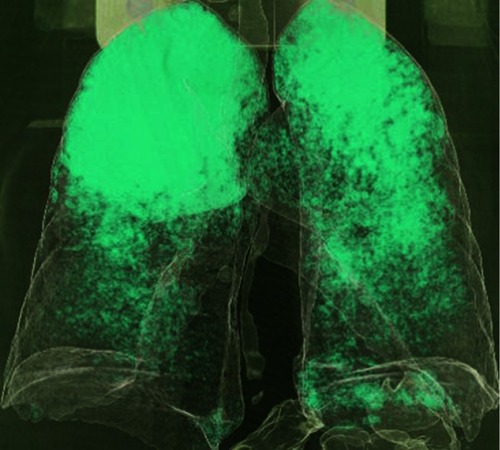
Figure 2 Bronchi segmentation. (A) Frontal view of a propagation algorithm to obtain a skeleton binary volume based on bi-thresholding. Arrow shows bronchi in which measurements were assessed. (B) Peripheral bronchus is designated (arrow) on a native transverse thin-section CT. (C) Thin-section CT scan used to obtain measurements. (D) A Laplacian of Gaussian algorithm was assessed to segment the designed airway and measure bronchial thickness.
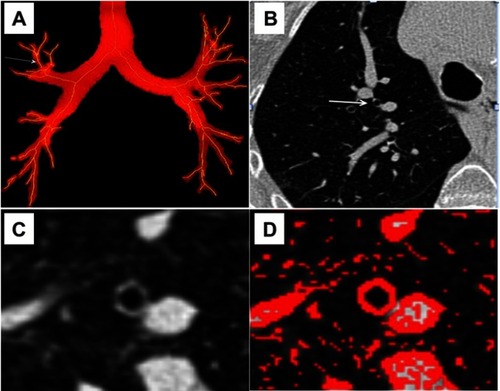
Figure 3 Pulmonary artery and aorta measurements. Ratio measurement obtained in a COPD patient in a transverse CT section.
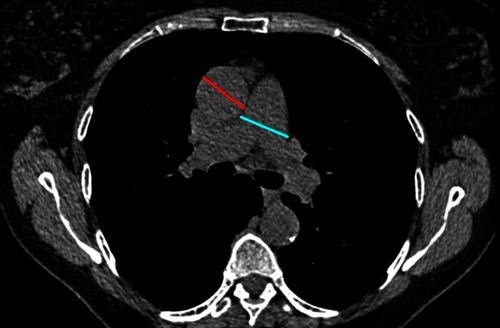
Figure 4 Measurement of cross-sectional areas (CSA) of small pulmonary vessels using Image J free-software. (A) CT image segmented within the threshold values from −500 to −1024 HU of lung field. (B) Segmented image segmented into binary images. (C) Mask image for the particle analysis after setting circularity within [0.9–1.0] and vessel size within [0–5] mm2.
![Figure 4 Measurement of cross-sectional areas (CSA) of small pulmonary vessels using Image J free-software. (A) CT image segmented within the threshold values from −500 to −1024 HU of lung field. (B) Segmented image segmented into binary images. (C) Mask image for the particle analysis after setting circularity within [0.9–1.0] and vessel size within [0–5] mm2.](/cms/asset/ca0af580-192b-464d-b93f-21bed2c9434b/dcop_a_207363_f0004_b.jpg)
Table 1 Summary of vessels analyzes in COPD with PH
Table 2 Summary of scores built in order to diagnose PH or severe PH in lung disease or COPD