
Figures & data
Figure 1 The Health Diary forms.
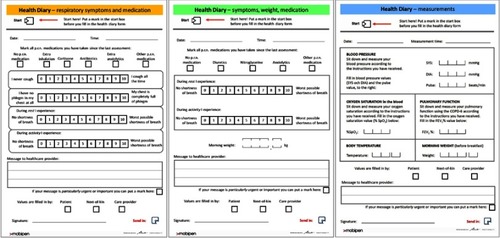
Table 1 Characteristics of the study sample CHF- versus COPD-subjects. Results are presented as mean ±1 SD (range) for continuous variables and percentage for categorical variables. P-values are from Chi-square test and Student’s t-test (P-value≥0.05)
Table 2 Study performance. Results are presented as mean ±1 SD (range) for continuous variables and percentage for categorical variables. P-values are from Chi-square test and Student’s t-test (P-value≥0.05)
Table 3 Primary outcome; exacerbation frequency and home health care contacts. Results are presented as means ±1 SD (range) for continuous variables . P-values are from Student’s t-test (P-value ≥0.05)
Figure 2 The figures illustrate exacerbations of (A) CHF and (B) COPD. A time span of 20 days is shown. Data are from the Health Diary system.
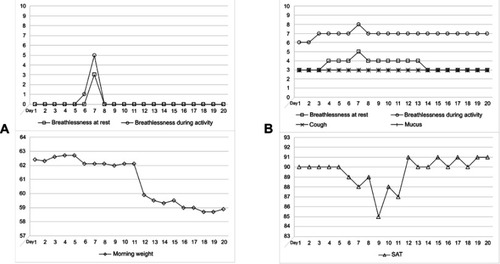
Table 4 Secondary outcome; times of hospitalization. Results are presented as means ±1 SD (range) for continuous variables and percentage for categorical variables. P-values are from Student’s t-test (P-value ≥0.05)
Table 5 Hospitalization during study period specified as disease-specific – urgent or planned – or due to other causes. Results are presented as means ±1 SD (range). P-values are from Student’s t-test (P-value ≥0.05)
Table 6 Questions and results from the questionnaire concerning various symptoms, medication, and use of the digital pen (translated into English). All questions were responded from 1 = ”I do not agree” to 5 = ”I fully agree”