
Figures & data
Figure 1 Schema for daily remote patient monitoring.
Notes: Patients were asked to seat themselves at a table in front of the monitoring equipment. They then applied the finger pulse oximeter. They were then taken through a series of screens which presented questions about their symptoms (CLEAR-Sx), treatment adherence (CLEAR-Rx) and physical activity (CLEAR-Ex). Next, they performed an inspiratory capacity maneuver followed by a forced vital capacity maneuver. Finally, they removed the pulse oximeter. The target completion time was set at 10 mins.
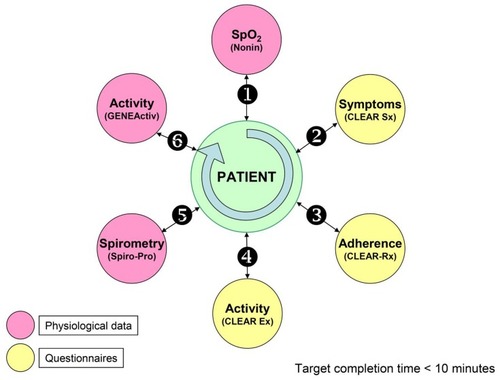
Figure 2 Diagrammatic representation of the statistical process control monitoring algorithm.
Notes: The 7-day rolling average for each physiological variable was tracked along with the standard deviation and prediction interval. Whenever a daily recorded value exceeded the 2-sided 95% prediction interval, then it was considered technically unacceptable and repeated. The lower of the two values was then captured. Whenever a daily recorded value fell below the 1-sided 95% prediction interval, then it was repeated and if still below the 1-sided 95% prediction interval, then it was considered to be a clinical event.
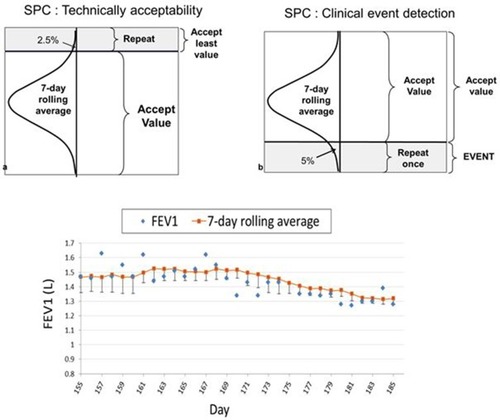
Table 1 Baseline Assessments For Subjects Undergoing Remote Patient Monitoring
Table 2 Summary Of Adherence To Each Component Of Remote Monitoring
Table 3 Breakdown Of Adherence To Each Component Of Remote Monitoring
Table 4 Summary Of Subset Daily Adherence Scores
Table 5 Breakdown Of Subset Adherence To Each Component Of Remote Monitoring