Figures & data
Table 1 Clinical character of included subjects
Figure 1 Levels of SDCs in subjects. Both SDC-1 and SDC-4 showed a downward trend in COPD patients (A-B), but the differences in the levels of SDCs between never smoking and ever-smoking controls were not observed (C-D).
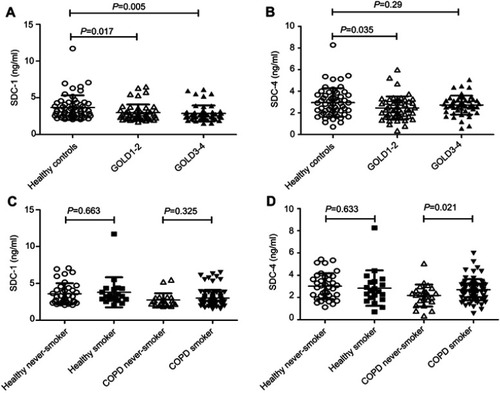
Table 2 Correlations of SDCs with lung function parameters in all subjects
Figure 2 Diagnostic accuracy of serum SDC-1 for COPD. Area under the curves (AUC) was calculated by the trapezoidal rule.
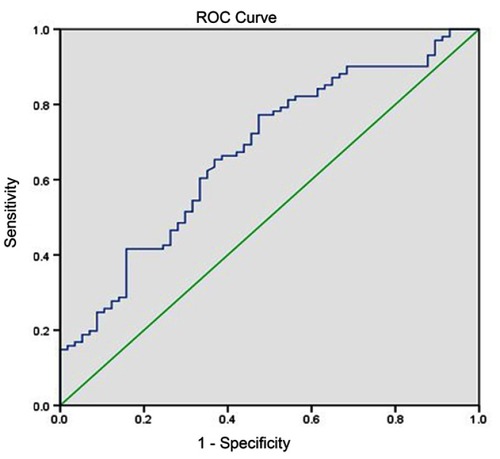
Figure 3 COPD patients with frequent exacerbations (FEs) had higher levels of CRP and lower levels of SDC-1 (A-B). Serum SDC-1 correlated negatively with CRP in COPD patients (C). Diagnostic accuracy of serum SDC-1 to differentiate FE was calculated (D).
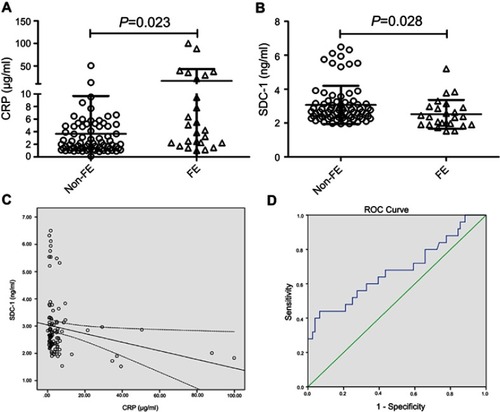
Table 3 Multivariate linear analysis with circulating SDC-1 as dependent variable
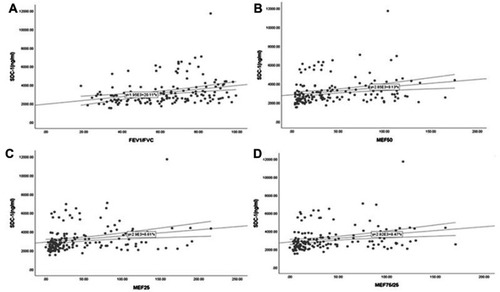
Figure S1 Serum SDC-1 correlated positively with the ratio of FEV1/FVC (A) and the parameters of small airway obstruction (SAO) (B-D) in all subjects.
Abbreviations: FEV1, forced expiratory volume in one second; FVC, forced vital capacity; SDC, syndecan.