
Figures & data
Figure 1 Monthly mean of PM10 aerosols in Heraklion, Crete from January to May for the years 2016–2018. Values represent the monthly mean (μg/m3) + standard deviation.
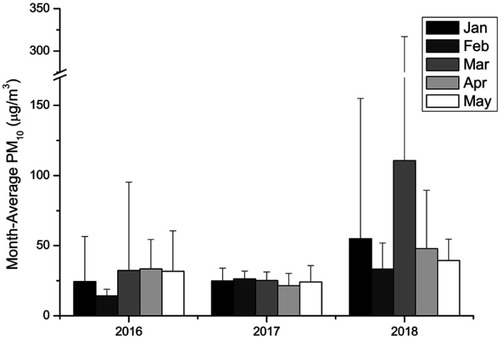
Figure 2 (A) Particulate matter with aerodynamic diameter below 10 μm (PM10) daily average and hourly mean day maximum during March 2018 in the geographic area of Heraklion. (B) Admissions to the departments of internal medicine (Int Med), cardiology (Cardio) and pulmonary (Pulmo) medicine during March 2018. (C) Total emergency department (ED) visits in Heraklion during the study period. (D) ED cases with dyspnea and COPD admissions at the University Hospital of Heraklion during the study period. We did not identify any increases in the studied parameters the days ensuing a desert dust storm.
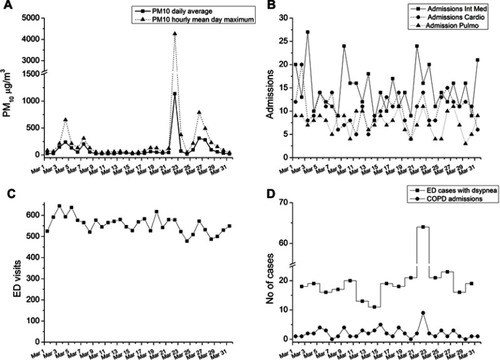
Table 1 Comparison of environmental and clinical information between days with and without desert dust storm. It is reasonable to have mostly southern winds during desert dust storms
Table 2 Pearson correlation results for the parameters tested. Significant results after Bonferroni correction of p (≤0.05/9=0.0056) are presented in bold