Figures & data
Table 1 Characteristics, spirometry data, and measurements of acrolein and oxidation for the subjects in the plasma study
Figure 1 Plasma acrolein concentrations in non-COPD smokers and patients with COPD. (A) Non-COPD smokers and total patients with COPD. (B) Non-COPD smokers and stage I, II, III, and IV COPD by the GOLD classification. **P<0.01 vs non-COPD smokers; ***P<0.001 vs non-COPD smokers. The bars indicate standard error (SE).
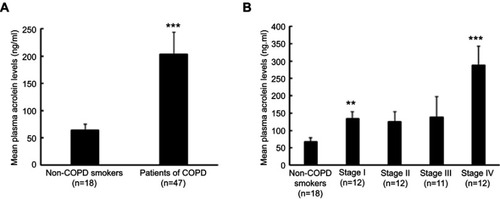
Figure 2 Correlation of acrolein concentrations with the derivatives of reactive oxygen metabolite (d-ROM) and bio-antioxidant power (BAP) levels in plasma. (A) Mon-COPD smokers (R =0.40, P>0.05). (B) Stage I and II COPD (R =0.04, P>0.05). (C) Stage III and IV COPD (R =0.69, P<0.05). (D) Non-COPD smokers (R =0.013, P>0.05). (E) Stage I and II COPD (R =0.003, P>0.05). (F) Stage III and IV COPD (R =0.425, P>0.05).
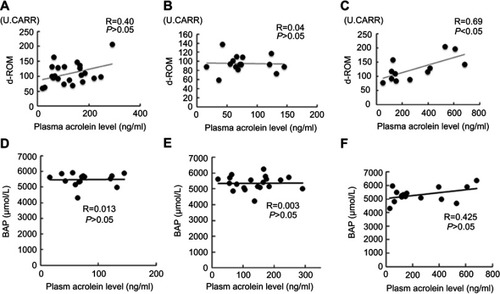
Figure 3 Correlation of plasma acrolein levels with smoking history. (A) Stage I and II COPD (R =0.13, P>0.05). (B) Stage III and IV COPD (R =0.46, P<0.05).
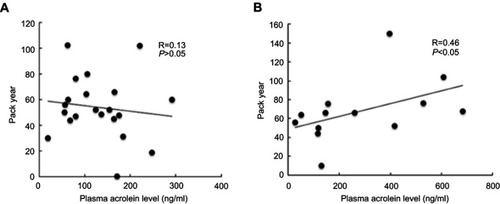
Figure 4 Corrected plasma acrolein levels with pulmonary functions in stage III and stage IV COPD. (A) Functional residual capacity (FRC) (R =0.47, P<0.05). (B) Residual volume (RV) (R =0.40, P<0.05).
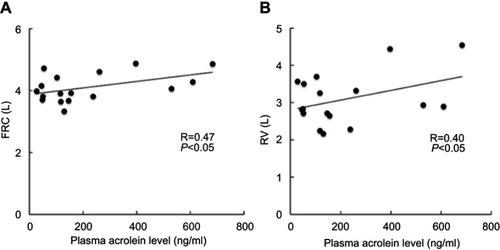
Table 2 Characteristics, spirometry data, and measurements of acrolein and oxidation for the subjects in the lung study
Figure 5 Acrolein concentrations in human lung tissues in non-COPD never-smokers, non-COPD smokers, and patients with COPD. P-values are based on comparisons to the non-COPD never smokers. The bars indicate standard error (SE).
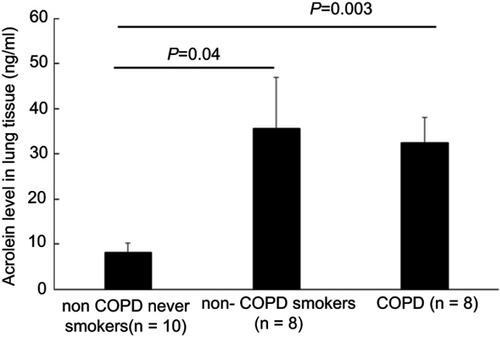
Figure 6 Correlation of acrolein concentration with the derivatives of reactive oxygen metabolite (d-ROM) and bio-antioxidant power (BAP) in human lung tissues. (A) Non-COPD never-smokers (R =0.69, P<0.05). (B) Non-COPD smokers (R =0.93, P<0.05). (C) Patients with COPD (R =0.59, P<0.05). (D) Non-COPD never smokers (R = −0.19, P>0.05). (E) Non-COPD smokers (R = −0.64, P<0.05). (F) Patients with COPD (R =0.38, P<0.05).
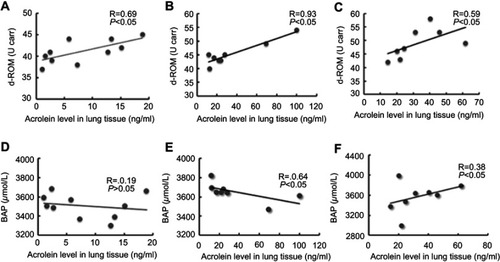
Figure 7 Corrected acrolein concentrations in lung tissues with respiratory expiratory flow rate (PEFR) in the stage I and stage II COPD (R = −0.62, P<0.05).
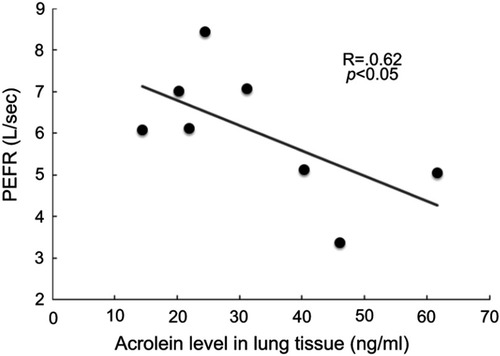
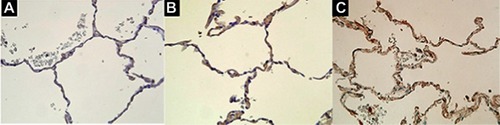
Figure 8 Immunohistochemistry of acrolein in human lung tissues. (A) Very weak staining in lung tissue from non-COPD never smokers. (B) Moderate staining in lung tissue from non-COPD smokers. (C) Moderate staining in lung tissue from patients with stage I and stage II COPD. Original magnification x 400.