Figures & data
Table 1 Baseline characteristics
Figure 1 (A) Histogram showing the prevalence of ischemic heart disease, remote myocardial infarction and heart failure as reported, in addition a combined history, if any of the previous diagnoses was reported. Moreover, the prevalence of patients with echocardiographic impairments is shown. For this purpose, left ventricular dilatation with an end-diastolic diameter (LVEDD) >56 is defined, moreover a reduced ejection fraction (LVEF) <50% as well as <40%. (B) Euler diagram showing the proportion of and overlap between patients with a combined history, LVEF < 50% and LVEDD >56 mm. Percentages are referred to the total cohort (n=1591).
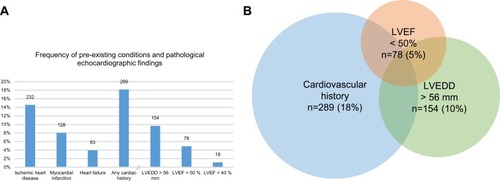
Figure 2 (A) Histogram showing the prevalence of cardiovascular medication as reported. The combined score is positive, if at least one of the compounds was present. ACE inhibitor/ARB=angiotensin-converting enzyme inhibitor or angiotensin receptor blocker; MRA=mineralocorticoid receptor antagonist. (B) Euler diagram showing the proportion of and overlap between patients with a positive medication score, LVEF <50%, and LVEDD >56 mm. Percentages are referred to the total cohort (n= 1591).
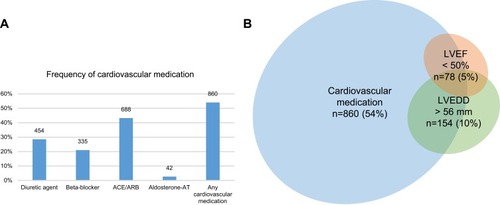
Figure 3 (A) Euler diagrams showing the proportion of and overlap between patients with a positive medication score, combined history and LVEF <50% in the total cohort (n =1591); percentages are referred to this. (B) In patients without isolated hypertension as defined in the methods section for LVEF <50% and (C) in patients without isolated hypertension for LVEDD >56 mm (n = 948); percentages are referred to this.
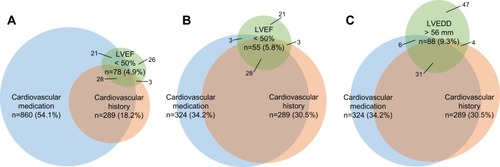
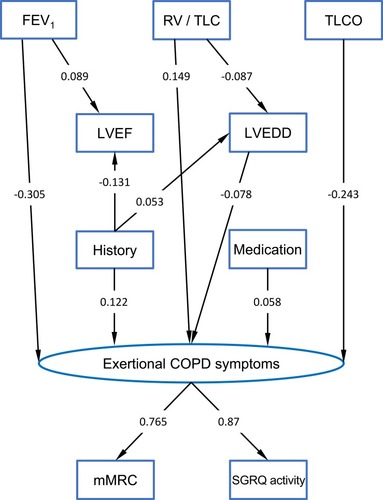
Figure 4 Structural equation model (SEM) describing the relationships between indices of lung function including the FEV1% predicted, the ratio of residual volume to total lung capacity (RV/TLC) and carbon monoxide diffusing capacity (0% predicted), echocardiographic measures including the left ventricular end-diastolic diameter (LVEDD, mm) and left ventricular ejection fraction (LVEF, %), the combined medication score, the combined history score, the modified British Medical Research Council dyspnea scale (mMRC) and the activity component of the Saint George's Respiratory Questionnaire (SGRQ). All measured (manifest) variables are indicated by rectangles. A latent variable (indicated by an oval) named “Exertional COPD Symptoms” with indicator variables mMRC and the SGRQ activity component was defined to summarize symptoms. The lines with one arrow describe unidirectional effects, and standardized regression coefficients are given at these arrows. Correlations between a number of variables were introduced to improve the fit. Lung function parameters were correlated with each other, moreover history and medication, furthermore, the error terms of LVEDD and LVEF. These correlations, which were not relevant for the validity of the structure, and the error terms needed for mathematical reasons for all dependent variables have been omitted for the sake of clarity. The numerical values of the respective unstandardized regression coefficients as well as measures of statistical significance are given in Table S1.