Figures & data
Table 1 Demographic and clinical data of analyzed study cohort
Figure 1 Quantitative 1H-NMR serum metabolomics differentiates patients with COPD from non-COPD smokers (NCS). (A) Mean normalized serum metabolite concentrations in NCS (n=59) and COPD (n=79) illustrated in a radar plot. Centroid and maximal dashed circle separately denote the minimal and maximal mean normalized concentration of all metabolites. Overall, the metabolome was dampened in COPD compared to NCS. (B) Box and whisker plots of normalized metabolite concentrations with FDR-corrected p-values ≤0.15. Concentrations of creatine, glycine, histidine and threonine were notably lower in COPD compared to NCS.
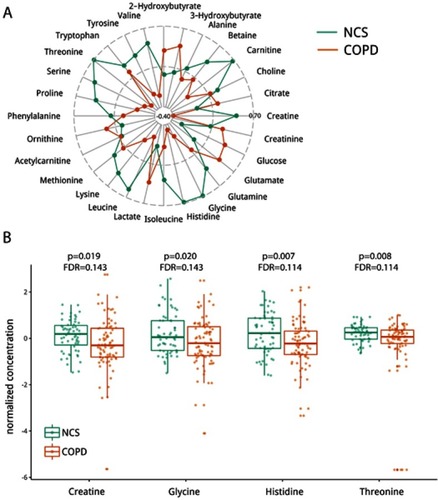
Figure 2 Metabolite concentrations are associated with pulmonary function, emphysema and inflammatory cytokine levels. Association heatmap between metabolomics and clinical data of subjects. Red and green squares reflect the negative and positive correlations, respectively; darker color denotes a higher correlation between metabolites and clinical index. For the statistically significant associations, the p-value is labelled in the corresponding square.
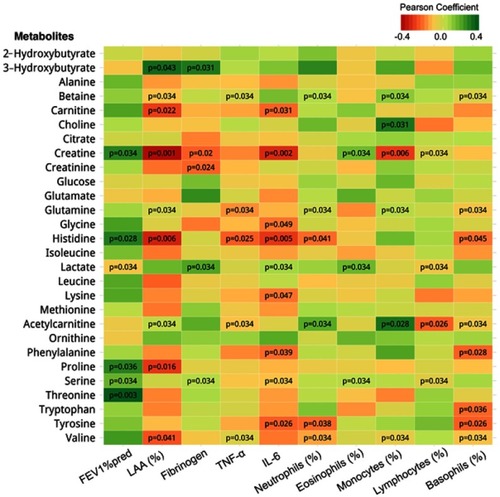
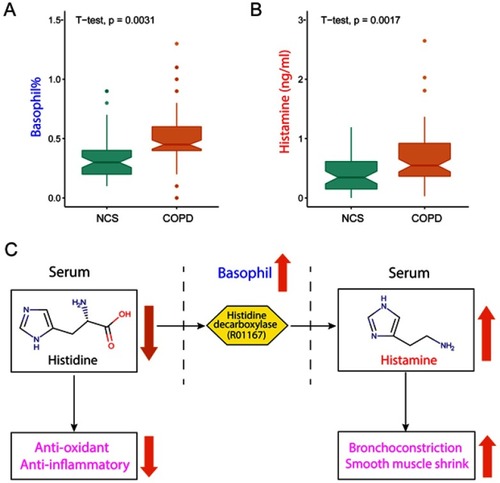
Figure 3 Histidine-histamine metabolism is disrupted in COPD. (A) Basophil (%) and (B) histamine concentrations are higher in COPD than in non-COPD smokers (NCS). Box and whisker plots (median, 25th and 75th percentiles, min and max). (C) Disruption of histidine-histamine metabolism in COPD. Elevated histamine can aggravate bronchoconstriction and shrink airway smooth muscle. Reduced histidine can cause recession of anti-oxidant and anti-inflammatory processes, both of which contribute to the pathogenesis and development of COPD or emphysema. R01167 is the KEGG identifier for the reaction catalysed by histidine decarboxylase.