
Figures & data
Table 1 Characteristics of patients in the study cohort. Number of patients (and percent of cohort) are reported unless otherwise indicated
Figure 1 Trends in the proportion of patients filling at least one prescription (left) and average dose-adjusted number of canisters (right*) for major COPD inhaled therapies, from 1997 to 2015.
Notes: *Numbers in brackets on the right panel legend give the average change between consecutive years. The baseline year for the trend is the first year of the medication’s presence in BC: 1997 for ICS, SABA, SAMA, LABA, and SAMA/SABA, 1999 for ICS/LABA, 2002 for LAMA, 2013 for LAMA/LABA (which is not presented in the figure due to the short duration).
Abbreviations: ICS, inhaled corticosteroids; LABA, long-acting beta-2 adrenoceptor agonists; LAMA, and long-acting muscarinic agents; SABA, short-acting beta-agonists; SAMA, short-acting muscarinic agents.
Abbreviations: ICS, inhaled corticosteroids; LABA, long-acting beta-2 adrenoceptor agonists; LAMA, and long-acting muscarinic agents; SABA, short-acting beta-agonists; SAMA, short-acting muscarinic agents.
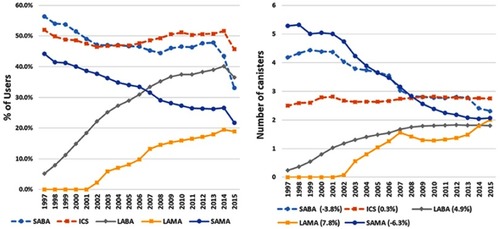
Figure 2 Trends in annual per-patient costs of COPD inhaled therapies from 1997 to 2015*.
Notes: *Numbers in brackets in the legend give the average change between consecutive years. The baseline year for the trend is the first year of the medication’s presence in BC: 1997 for ICS, SABA, SAMA, LABA, and SAMA/SABA, 1999 for ICS/LABA, 2002 for LAMA, 2013 for LAMA/LABA (which is not presented in the figure due to the short duration).
Abbreviations: ICS, inhaled corticosteroids; LABA, long-acting beta-2 adrenoceptor agonists; LAMA, and long-acting muscarinic agents; SABA, short-acting beta-agonists; SAMA, short-acting muscarinic agents.
Abbreviations: ICS, inhaled corticosteroids; LABA, long-acting beta-2 adrenoceptor agonists; LAMA, and long-acting muscarinic agents; SABA, short-acting beta-agonists; SAMA, short-acting muscarinic agents.
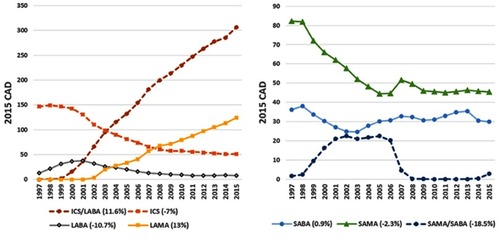
Figure 3 Trends in the percent of users on combination therapies (left), and (right*) average medication possession ratio per patient-year from 1997 to 2015.
Notes: *Numbers in brackets in the legend of the right panel give the average change between consecutive years. The baseline year for the trend is the first year of the medication’s presence in BC: 1997 for ICS, SABA, SAMA, LABA, and SAMA/SABA, 1999 for ICS/LABA, 2002 for LAMA, 2013 for LAMA/LABA (which is not presented in the figure due to the short duration).
Abbreviations: ICS, inhaled corticosteroids; LABA, long-acting beta-2 adrenoceptor agonists; LAMA, and long-acting muscarinic agents; ICS/LABA/LAMA, triple therapy.
Abbreviations: ICS, inhaled corticosteroids; LABA, long-acting beta-2 adrenoceptor agonists; LAMA, and long-acting muscarinic agents; ICS/LABA/LAMA, triple therapy.
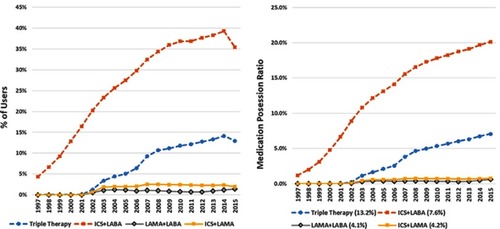
Table 2 Factors associated with the number of dispensed canisters of inhaled therapy in COPD patients