76
Views
4
CrossRef citations to date
0
Altmetric
Original Research

ST2 Predicts Mortality In Patients With Acute Hypercapnic Respiratory Failure Treated With Noninvasive Positive Pressure Ventilation

ORCID Icon, , ORCID Icon, , &
Pages 2385-2393 | Published online: 23 Oct 2019

Figures & data

Table 1 Characteristics Of The Patients, As A Whole Group And Divided Into Subgroups

Figure 1 Correlation between ST2 values measured with Olink biomarker panel and Presage ST2 clinical assay.

Figure 1 Correlation between ST2 values measured with Olink biomarker panel and Presage ST2 clinical assay.

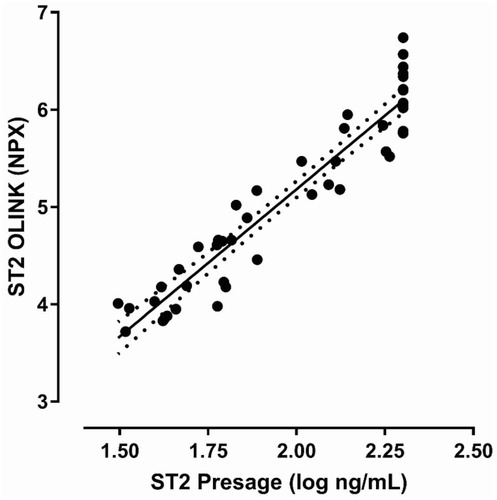
Table 2 Relationship Between ST2 And Risk Of 28 Days And 18 Months Mortality

Figure 2 Kaplan–Meier plot showing cumulative mortality during 18 months follow-up period. Tertile 1 denotes the lowest values of ST2, and Tertile 3 the highest values.

Figure 2 Kaplan–Meier plot showing cumulative mortality during 18 months follow-up period. Tertile 1 denotes the lowest values of ST2, and Tertile 3 the highest values.

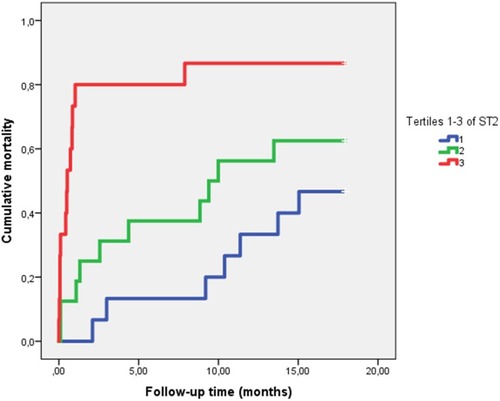
Table 3 ST2, pCO2 And pH Values Before Start Of Treatment, And After 4 And 12 hrs