
Figures & data
Table 1 Characteristics Considered For Dividing Patients Into The Three Different Phenotypes
Table 2 Subjects’ Demographic And Functional Characteristics
Figure 1 Recruitment flowchart.
Abbreviations: COPD, chronic obstructive lung disease; ACO, asthma/COPD overlap; FE, frequent exacerbator, pulmonary comorbidities included, tuberculosis sequelae, pulmonary fibrosis and lung cancer.
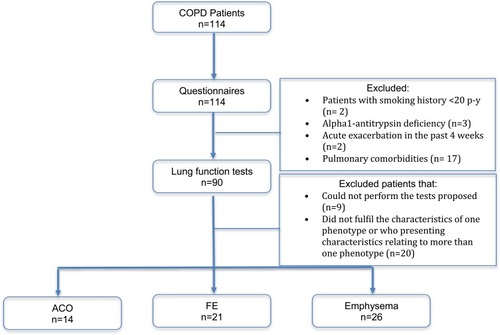
Table 3 Genotypic Frequency In The Phenotypes Studied
Table 4 Allelic And Genotypic Frequency In 2 × 2 Comparisons With The Rs 13118928 HHIP Gene Polymorphism