Figures & data
Figure 1 Study design.
Abbreviations: TIO/OLO, tiotropium bromide/olodaterol; UMEC/VI, umeclidinium/vilanterol.
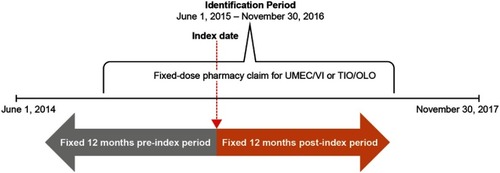
Figure 2 Patient enrollment.
Abbreviations: ICS, inhaled corticosteroid; LABA, long-acting β2-agonist; MAPD, Medicare Advantage with Part D; MITT, multiple inhaler triple therapy; PDP, Part D-only, TIO/OLO, tiotropium bromide/olodaterol; UMEC/VI, umeclidinium/vilanterol.
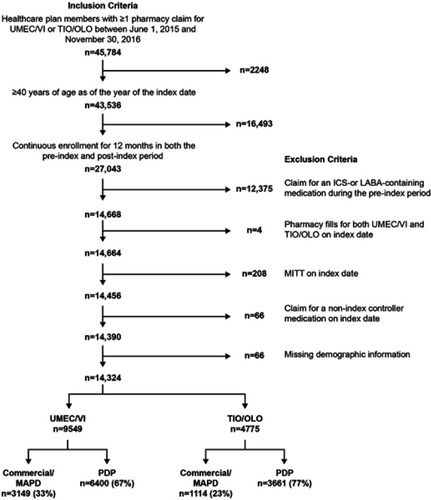
Table 1 Pre-index patient demographics and clinical characteristics before IPTW
Table 2 Pre-index patient demographics and clinical characteristics after IPTW
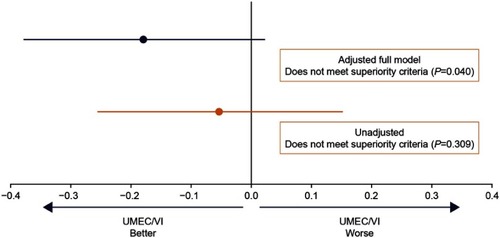
Figure 3 ITT analysis of difference in rescue medication use between the UMEC/VI and TIO/OLO cohorts. Covariates included in the adjusted model are shown in Table S2.
Abbreviations: ITT, intent-to-treat; SABA, short-acting β2-agonist; SAMA, short-acting muscarinic antagonist; TIO/OLO, tiotropium bromide/olodaterol; UMEC/VI, umeclidinium/vilanterol.
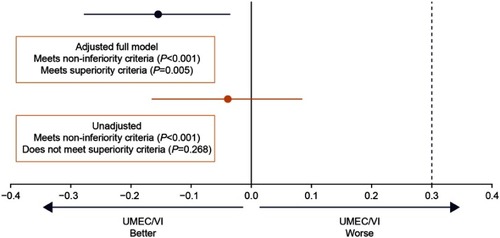
Figure 4 On-treatment sensitivity analysis of difference in rescue medication use between the UMEC/VI and TIO/OLO cohorts. Covariates included in the adjusted model are shown in Table S2.
Abbreviations: SABA, short-acting β2-agonist; SAMA, short-acting muscarinic antagonist; TIO/OLO, tiotropium bromide/olodaterol; UMEC/VI, umeclidinium/vilanterol.