
Figures & data
Figure 1 Flow chart of study design.
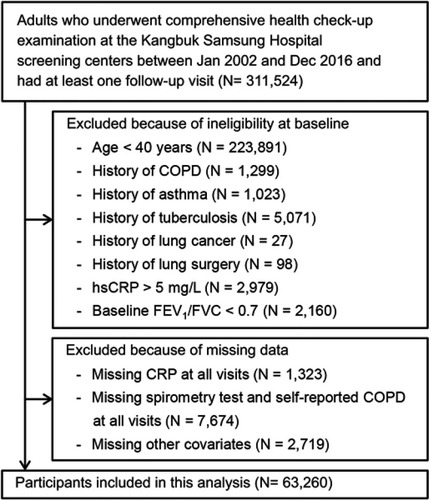
Table 1 Baseline characteristics of study participants by smoking status
Table 2 Hazard ratios for incident COPD by time-varying CRP levels
Figure 2 Hazard ratio for incident COPD by CRP levels at baseline. (A) represents overall hazard ratio and (B) represents hazard ratio by smoking status. Curves represent adjusted hazard ratios (solid lines) and their 95% confidence intervals (dashed lines) based on restricted cubic splines for CRP with knots at the 5th, 35th, 65th, and 95th percentiles of their sample distributions. The reference values (diamond dots) were set at the 10th percentile of the distributions (corresponding to 0.1 mg/L). Models were adjusted for age, sex, center, body mass index, smoking status, physical activity, alcohol consumption. Bars represent the frequency distribution of CRP.
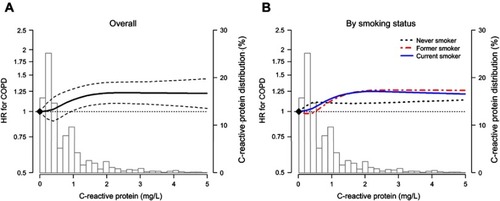
Figure 3 Associations between CRP (90th vs 10th percentile) and COPD by pre-specified subgroups. Models were adjusted for age, sex, center, smoking status, physical activity, alcohol consumption, and BMI.
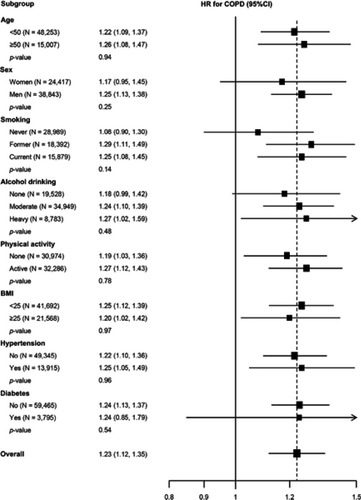
Table S1 Baseline characteristics of study participants by incident COPD status