Figures & data
Table 1 Baseline Characteristics of the Patients
Figure 1 Comprehensibility of the C-PPAC questionnaire expressed in Likert scores for the 12 questions. Radar chart representing every Likert category from 0 to 5, 0 being “not at all clear” to 5 being “absolutely clear” (the percentage of each Likert category is presented on the y-axis; Likert 0 and 1 were not visible due to the presence of < 5% of the patients).
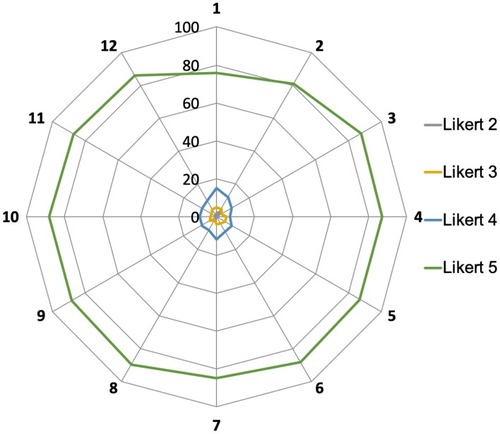
Figure 2 (A) Difficulty score of the C-PPAC questionnaire in patients with and without LTOT. LTOT = long term oxygen therapy. (B) Difficulty score of the C-PPAC questionnaire according to the influence of rainfall.
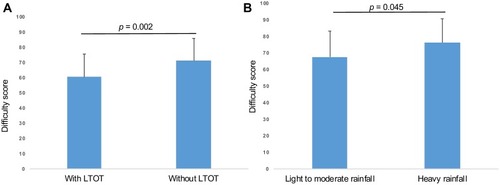
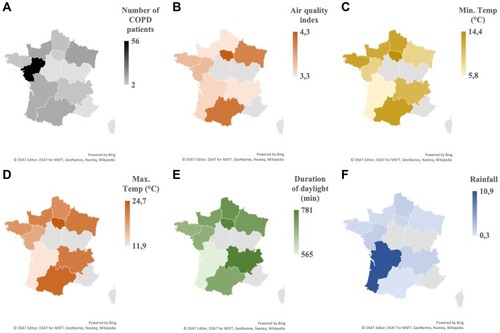
Figure 3 Regional dispersion of variables in France. (A) Number of COPD patients. (B) Air quality index {from 0 = very good to 10 =very bad quality). (C) Minimum temperature (°C). (D) Maximum temperature (°C). (E) Duration of daylight (min). (F) Intensity of rainfall (mm). All variables were obtained on a daily basis measure and expressed as mean week-value, except for (A).