Figures & data
Figure 1 Linked-risk equation model. Blue lines indicate the relationship between the central attributes in the different time periods. Orange lines indicate the relationship between intermediate outcomes and exacerbations. Black lines indicate the relationship between the central attributes and the final health outcomes. Adapted from Briggs AH, Baker T, Risebrough NA, et al (2017). Development of the Galaxy Chronic Obstructive Pulmonary Disease (COPD) Model Using Data from ECLIPSE: Internal Validation of a Linked-Equations Cohort Model Med Decis Making, 37(4): 469–480. https://doi.org/10.1177/0272989X16653118. Copyright © 2017 by the authors. Reprinted by permission of SAGE Publications, Inc.Citation11 *Calculated (in mL) using the risk equation at 1 year and converted to FEV1% predicted based on the cohort profile.
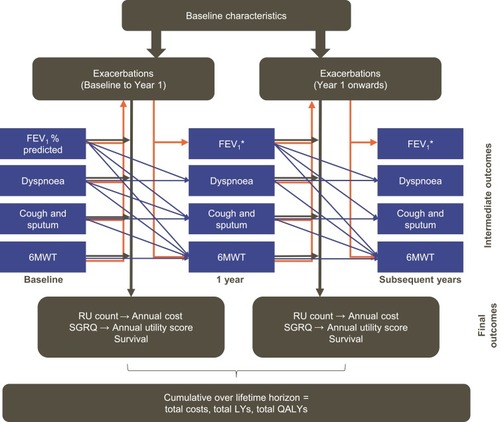
Table 1 Summary Of Model Inputs
Table 2 Cumulative And Incremental Lifetime Outcomes Of FF/UMEC/VI Versus FF/VI
Figure 2 Incremental cost-effectiveness plane for FF/UMEC/VI versus FF/VI (A), and tornado plot of sensitivity and scenario analyses (B). *Assume 100% market share of product.
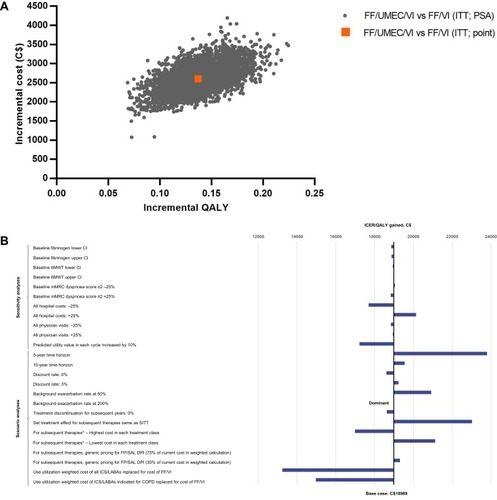
Figure 3 Net benefit acceptability curves for FF/UMEC/VI versus FF/VI.
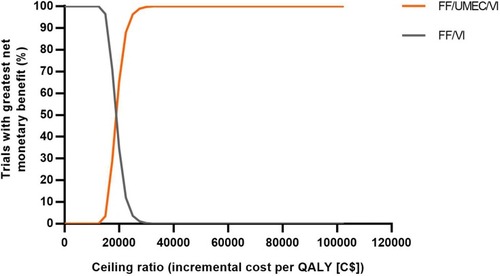
Table 3 Cumulative And Incremental Lifetime Outcomes Of FF/UMEC/VI Versus FF/VI
Figure 4 Incremental cost-effectiveness plane for FF/UMEC/VI versus UMEC/VI (A), and tornado plot of sensitivity and scenario analyses (B). *Assume 100% market share of product.
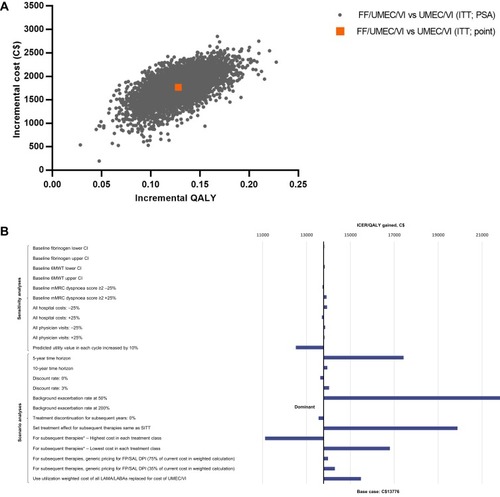
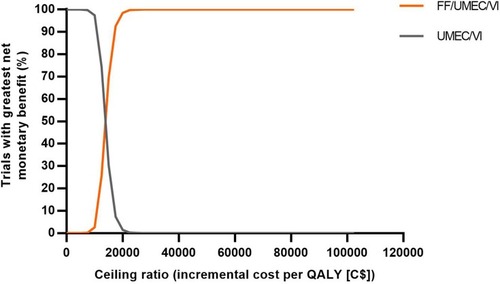
Figure 5 Net benefit acceptability curves for FF/UMEC/VI versus UMEC/VI.