
Figures & data
Table 1 Comparison Of Clinical Data Between Depression And No Depression Of COPD Patients
Figure 1 Correlation analyses between the BDI-II score and (A) total SGRQ-C score, (B) the 6MWD, (C) the CAT, and (D) BMI.
Abbreviations: BDI, Beck Depression Inventory; SGRQ-C, the COPD-specific version of the St George’s Respiratory Questionnaire; 6MWD, 6 min walk distance; CAT, COPD Assessment Test; BMI, body mass index.
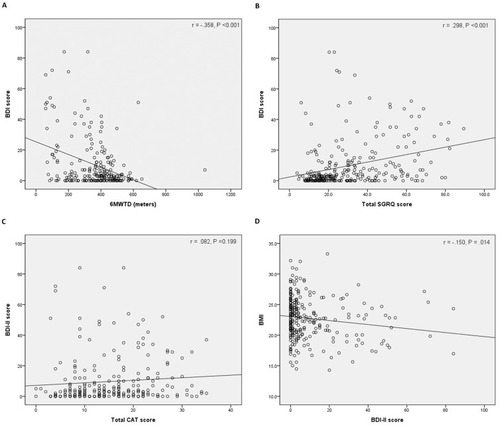
Table 2 St. George’s Respiratory Questionnaire Score
Figure 2 Changes in (A) SGRQ-C score, (B) CAT score, (C) 6MWD, and (D) number of acute exacerbations/year by follow-up timepoint.
Abbreviations: SGRQ-C, the COPD-specific version of the St George’s Respiratory Questionnaire; 6MWD, 6 min walk distance; CAT, COPD Assessment Test.
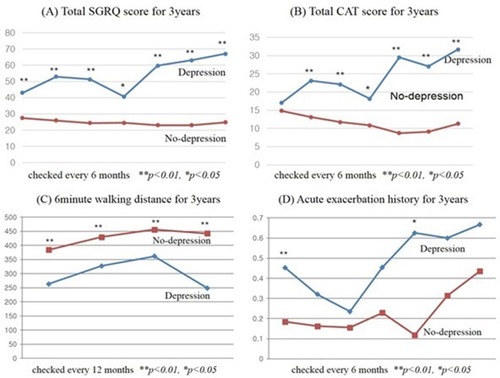
Table 3 COPD Assessment Test (CAT) Score And Depression
Table 4 Multivariable Logistic Regression Analysis For Factors Predictive Of Probable Depression (BDI-II ≥17)
Table 5 Comparison Of The Four Subgroups Stratified By BDI-II ≥17 And SGRQ ≥25 (n=268)