Figures & data
Table 1 Characteristics of patients
Table 2 Univariate and multivariate regression analysis of step count
Figure 1 Correlations between step count and associated variables: (A) age, (B) mMRC, (C) IC, and (D) FEV1%pred.
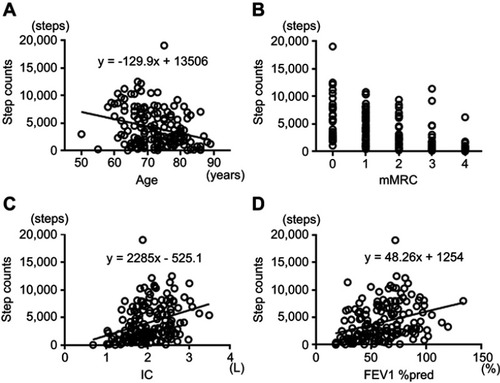
Figure 2 Histogram of measured step count.
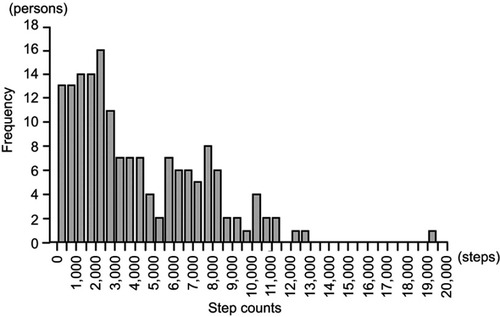
Figure 3 Correlation between measured and calculated step count: (A) scatter plot, r=0.470, P<0.0001 and (B) Bland–Altman plot. There were fixed and proportional biases (mean of difference 95% CI: 0.1163–1816.2, limit of agreement: −4909 to 6726). Broken lines indicate mean difference 95% CI and dotted lines indicate limit of agreement.
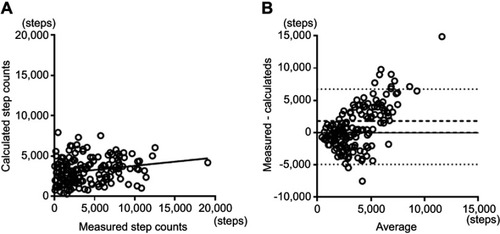
Figure 4 Correlation between measured and calculated step counts in patients with <6500 steps: (A) scatter plot, r=0.435, P<0.0001 and (B) Bland–Altman plot. There was no systematic bias. (mean of difference 95% CI: −773.32 to 0.06537, limit of agreement: −3908.7 to 3135.5). Broken lines indicate mean difference 95% CI and dotted lines indicate limit of agreement.
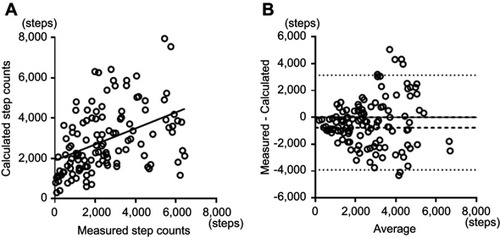
Table S1 Characteristics of patients
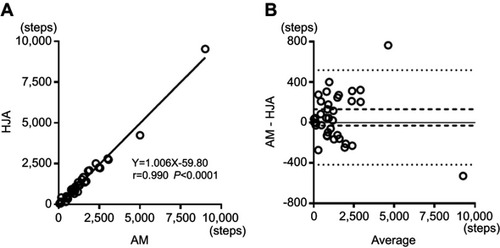
Figure S1 Correlation between step counts by AM and HJA-750C. (A) scatter plot, r=0.990 P<0.0001 and (B) Bland–Altman plot. There was no systematic bias. (mean of difference 95% CI: −30.23 to 131.43, limit of agreement: −417.6 to 518.9). Broken lines indicate mean difference 95% CI and dotted lines indicate limit of agreement.
Abbreviations: HJA-750C, Active Style Pro HJA-750C; AM, Actimarker.