Figures & data
Table 1 Baseline Demographic and Spirometric Characteristics
Figure 1 Recruitment and exclusion of subjects.
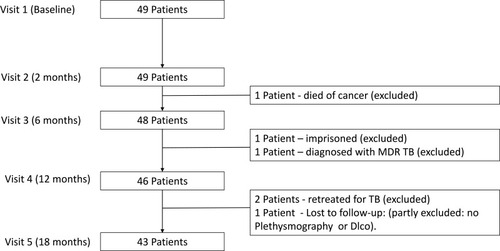
Table 2 Lung Physiology Data at 2, 6 (Treatment Completion) and 18 Months (One Year After Treatment Completion)
Figure 2 Median lung volumes measured by plethysmography at 2 (Visit 2), 6 (Visit 3, treatment completion) and 18 months (Visit 5).
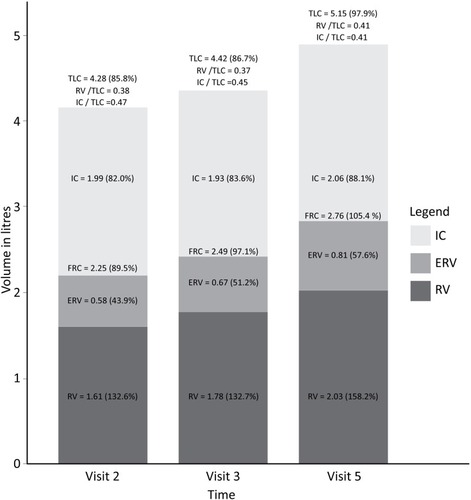
Figure 3 Venn diagram presenting in approximate proportions the number of patients with single and combinations of lung function abnormalities one year after completion of TB treatment (Visit 5): Airflow obstruction, gas trapping, restriction, and low diffusing capacity. Airflow obstruction was defined using the FEV1/FVC < lower limit of normal definition; restriction was defined as total lung capacity (TLC) less than 80% predicted; gas trapping on plethysmography was defined as a residual volume (RV) to TLC ratio (RV/TLC) of greater than 45%; and a low DLco (corrected for haemoglobin) was defined as values of less than 80% predicted.
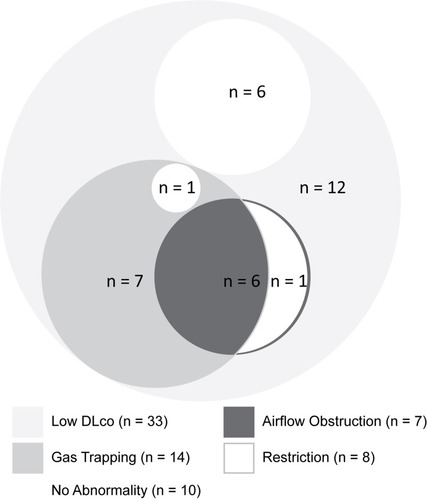
Table 3 Quantitative Computed Tomography Values for Subjects with Scans Performed at 2, 6 (Treatment Completion) and 18 Months (One Year After Treatment Completion)
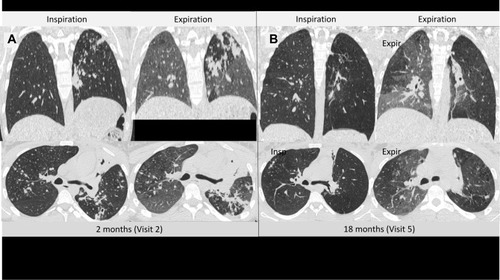
Figure 4 Inspiratory and expiratory, axial and coronal computed tomography images for a 20-year-old female, after 2 months of tuberculosis treatment (Visit 2) (A), and 1 year after treatment completion (Visit 5) (B). Resolution of infiltrates of tuberculosis and improvement in inspiratory lung volumes was found. However, areas of gas trapping can be seen on the Visit 5 expiratory scan which were not present at 2 months, and are particularly prominent in regions where infiltrates of tuberculosis have resolved.