Figures & data
Table 1 Demographic Data in SPIROMICS Cohort
Figure 1 Overall BDR defined by different spirometric measures in the SPIROMICS cohort.
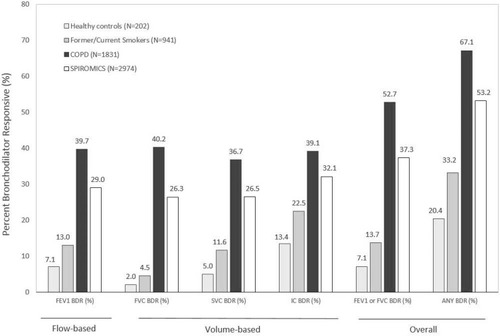
Table 2 Baseline Clinical Characteristics of FVC-BD Responders and FVC-BD Nonresponders
Figure 2 Distribution of flow (FEV1) and volume (FVC) BDR in COPD based on (A) spirometric GOLD grades, (B) GOLD groups defined by symptoms, exacerbations, and spirometric grades (revision 2011), (C) GOLD groups defined by symptoms and exacerbations only (revision 2019), and (D) percentage emphysema <−950 HU.
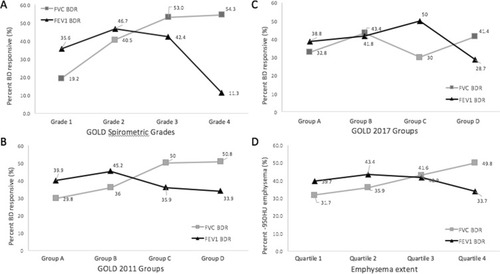
Figure 3 Parametric Response Mapping analysis. The extent of small airway disease (PRMfSAD) shows that FVC-BD responders have more PRMfSAD on functional imaging in comparison to FVC-BD nonresponders. There is no difference between FEV1 BD responders and nonresponders in the extent pf PRMfsad.
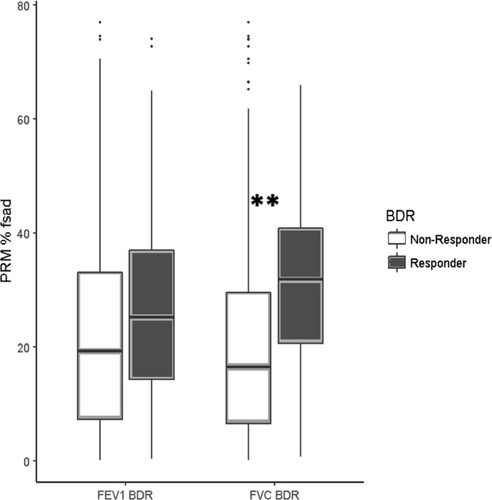
Figure 4 Kaplan–Meier plot of overall survival up to 3 years: FVC-BD responders (88.1%) vs FVC-BD nonresponders (91.7%) (P<0.05).
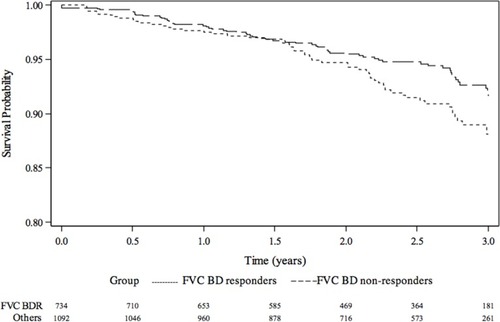
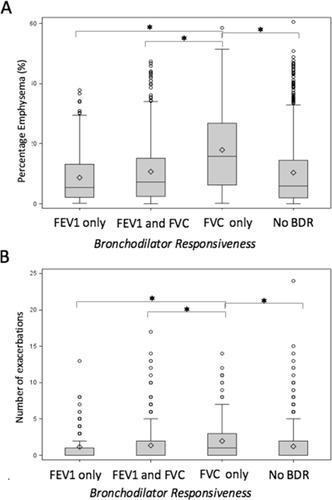
Figure 5 Comparison of isolated BDRFVC among individuals with COPD in comparison to dual FVC and FEV1 BDR, isolated BDRFEV1 without BDRFVC and complete nonresponsiveness by either FEV1 or FVC: (A) FVC-BD responders who do not show BDRFEV1 have more emphysema in comparison to the other three groups, (B) FVC-BD responders who do not show BDRFEV1 have a higher median rate of exacerbations in comparison to the other groups.