Figures & data
Table 1 Patient Characteristics
Table 2 Comparison of the Absolute Values of HI Between Patients with Mild-to-Moderate and Severe Disease (GOLD Stage I and II vs GOLD Stage III and IV)
Figure 1 An example of air trapping heterogeneous distribution on full-expiration (A–D). The blue colored areas showed pixels of <-856 HU, suggestive of air trapping. (A,B) which were the different coronal slices of the same patients (not same with C,D) showed a heterogeneous distribution of AT. (A1,A2) were the same coronal slice and (B1,B2) were the same coronal slice. FEV1 (L)= 2.18, FEV1(%pred)= 71%, FVC (L)= 3.67, FEV1/FVC= 59%, IC/TLC= 40%. (C,D) which were the different coronal slices of the same patients showed a homogeneous distribution of AT. (C1,C2) were the same coronal slice and (D1,D2) were the same coronal slice. FEV1 (L)= 0.74, FEV1(%pred)= 30%, FVC (L)= 2.16, FEV1/FVC= 34%, IC/TLC= 20%.
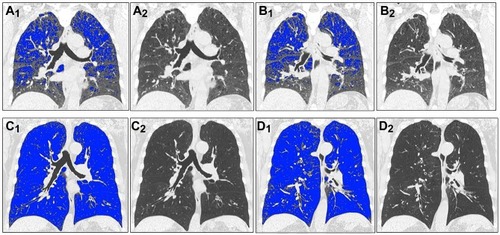
Figure 2 An example of emphysema heterogeneous distribution on full-inspiration (A–D). The blue colored area showed pixels of <-950HU, suggestive of emphysema. (A,B) were the different coronal slices of the same patients (not same with C,D). (A1,A2) were the same coronal slice and (B1,B2) were the same coronal slice. FEV1 (L)= 2.18, FEV1(%pred)= 71%, FVC (L)= 3.67, FEV1/FVC= 59%, IC/TLC= 40%. (C,D) were the different coronal slices of the same patients. (C1,C2) were the same coronal slice and (D1,D2) were the same coronal slice. FEV1 (L)= 0.74, FEV1(%pred)= 30%, FVC (L)= 2.16, FEV1/FVC= 34%, IC/TLC= 20%.
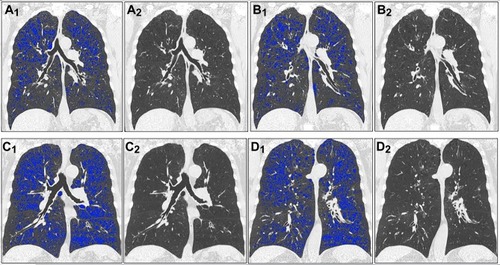
Table 3 A Comparison of PFT Parameters Between Patients with Upper-Zone and Lower-Zone Predominance
Table 4 A Comparison of PFT Parameters Between Patients with Left-Lung and Right-Lung Predominance
Table 5 Multivariate Linear Regression Analysis Showing the Relationship Between CT Parameters and Pulmonary Function Parameters
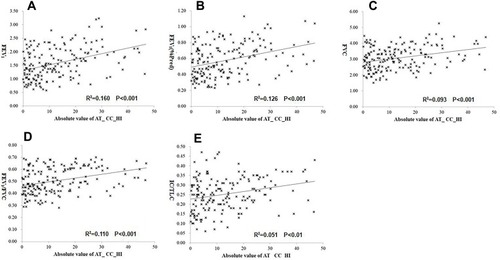
Figure 3 The correlation between the absolute value of AT_ CC_HI and pulmonary function. (A-E) showed the correlation between the absolute value of AT_CC_HI and PFT parameters, including FEV1(A), FEV1(%pred) (B), FVC (C), FEV1/FVC (D) and IC/TLC (E).