Figures & data
Table 1 Classification Of Exacerbation Severity In The RESTORE Study Based On Health Care UtilizationCitation26
Table 2 Demographic And Baseline Characteristics Of Patients (ITT population)
Figure 1 Patient disposition in RESTORE study.
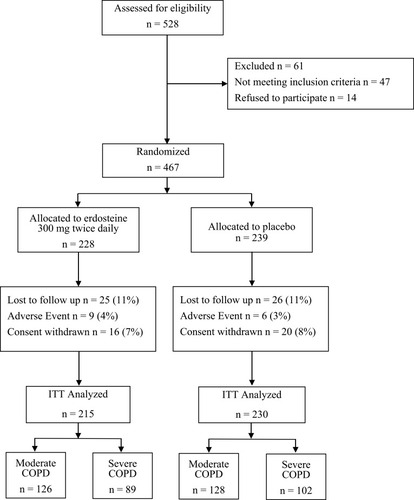
Figure 2 Exacerbation rate according to COPD severity subgroup and for all patients in the RESTORE study.
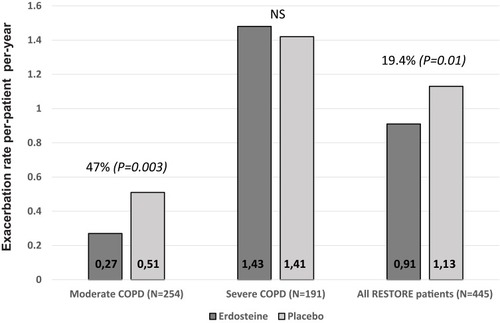
Table 3 Exacerbation Duration (In days) By Exacerbation Severity (Mild Or Moderate-To-severe), COPD Severity And Treatment Group
Figure 3 Exacerbation-free time (mean days) in patients with moderate COPD and for all patients in the RESTORE study.
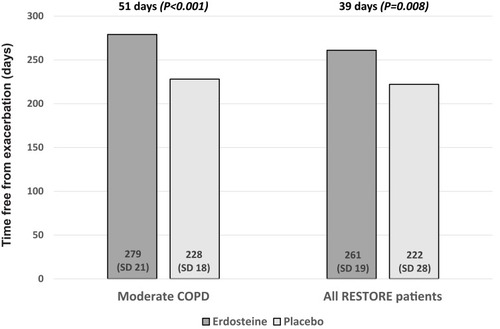
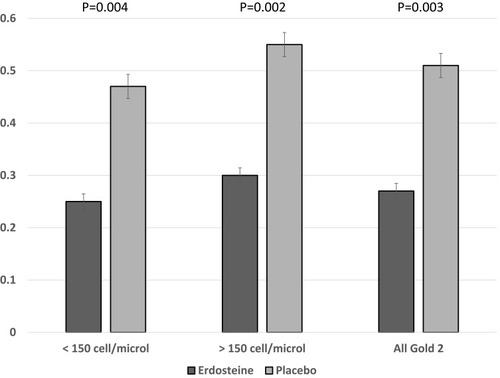
Figure 4 Exacerbation rate by blood eosinophil count (<150 cells/μL and ≥150 cells/μL) for patients with moderate COPD by treatment group.