
Figures & data
Figure 1 Study design. After screening visit (S), eligible patients were randomized (R) to three 1-day treatment periods. The treatments comprised a single oral dose of imidafenacin 0.1 mg, imidafenacin 0.2 mg, or placebo.
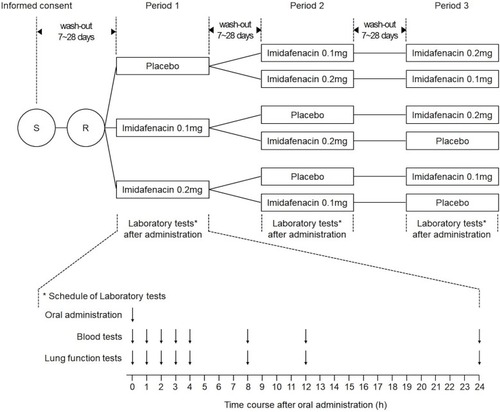
Table 1 Baseline Characteristics Of Patients
Figure 2 Analyses for the enrolled subjects.
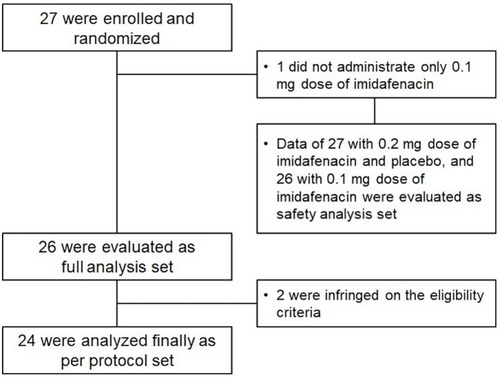
Table 2 Changes In FEV1 After Oral Imidafenacin When Compared With Placebo
Figure 3 Temporal changes in FEV1 (L). The monitoring period was 24 hrs beginning at the time of oral administration of imidafenacin (analysis set: PPS). All data were represented as means ± SEM. *P<0.05 versus placebo at each time period.
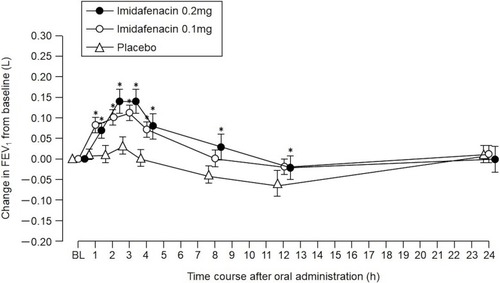
Figure 4 Pharmacokinetic data of plasma concentrations of imidafenacin. Sample sizes as full analysis set of imidafenacin 0.1 mg and 0.2 mg were 26 and 27, respectively. Data were plotted as circles. Standard deviations were expressed as bars.
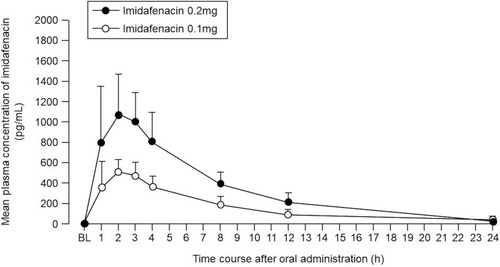
Figure 5 Relationship between plasma imidafenacin concentration and change in FEV1. Plasma imidafenacin level was positively correlated with change in FEV1 during the 24-hrs period immediately after imidafenacin administration. Data represent mean values for all patients at each time point.
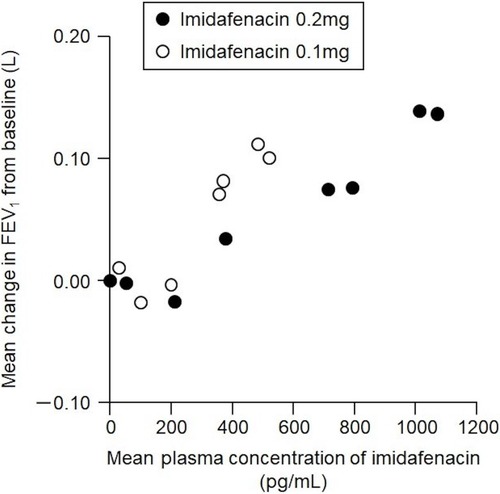
Table 3 Summary of Adverse Events