
Figures & data
Figure 1 Study flow diagram.
Abbreviation: COPD, chronic obstructive pulmonary disease.
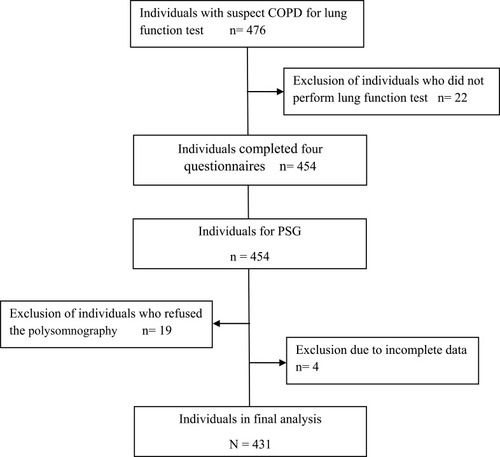
Table 1 Characteristics Of COPD Cohort And Comparison With OVS
Table 2 Descriptive Characteristics Of The Study Population For ESS, SACS, BQ And SBQ
Table 3 Predictive Parameters Of ESS, SACS, BQ, And SBQ
Figure 2 ROC curves for ESS, SACS, BQ, and SBQ in predicting mild-moderate-severe OSA (AHI ≥5 events/h) in patients with COPD.
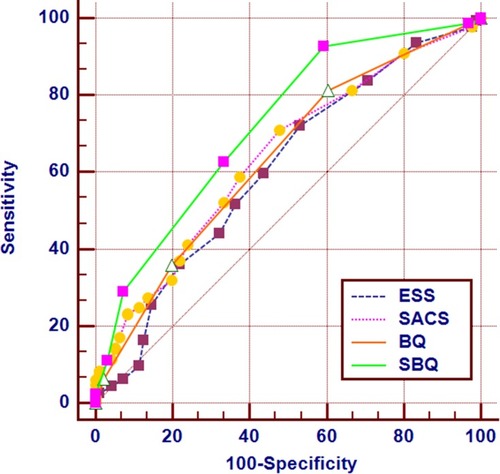
Figure 3 ROC curves for ESS, SACS, BQ, and SBQ in predicting moderate-to-severe OSA (AHI ≥15 events/h) in patients with COPD.
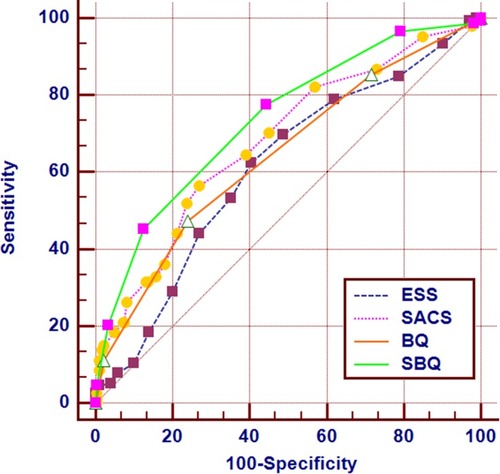
Figure 4 ROC curves for ESS, SACS, BQ, and SBQ in detecting severe OSA (AHI ≥30 events/h) in patients with COPD.
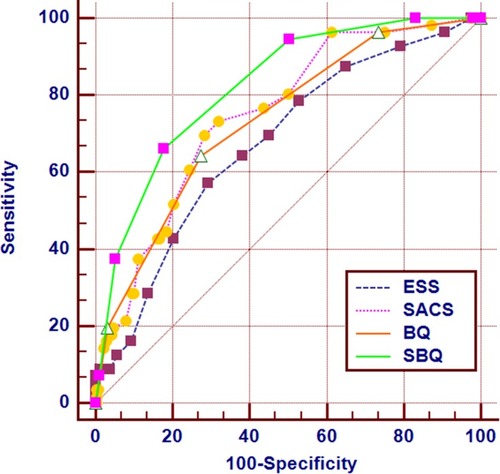
Table 4 Pairwise Comparison Of ROC Curves Of ESS, SACS, BQ, And SBQ