Figures & data
Table 1 Clinical Characteristics Of The 32 Study Participants
Table 2 Measurements Of Emphysematous Lesions Obtained On U-HRCT Scans Versus Conventional HRCT Scans At Different Density Thresholds
Figure 1 Visualization of lesions of pulmonary emphysema on ultra-high-resolution CT (U-HRCT) and conventional HRCT images. On an U-HRCT image (left), the margins of pulmonary emphysema are more clearly depicted than on a conventional HRCT image (right), particularly the relatively small emphysematous lesions (rectangles).
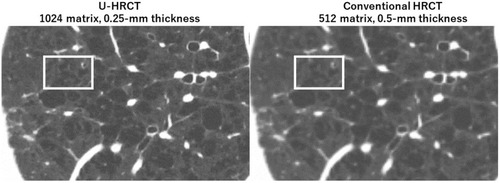
Figure 2 Ultra-high-resolution CT (U-HRCT) image compared with a conventional HRCT image for the detection of emphysema. At the threshold setting of <−950 Hounsfield units, emphysematous lesions are identified as dark-red areas on axial images. Some of the very small emphysematous lesions, which is clearly identified on the U-HRCT image (left), cannot be seen on the identical conventional HRCT image (right).
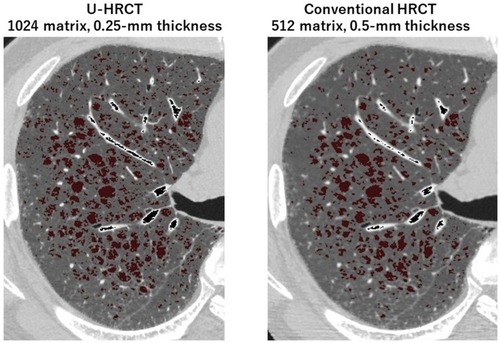
Figure 3 Quantitative measurements of lesions of pulmonary emphysema on ultra-high-resolution CT (U-HRCT) and conventional HRCT scans. Red areas are emphysematous lesions identified by the software (<−950 Hounsfield units). In this COPD patient, the percentage low attenuation volume (LAV%) was 32.8% on the U-HRCT scan (left) and 30.7% on the conventional HRCT scan (right).
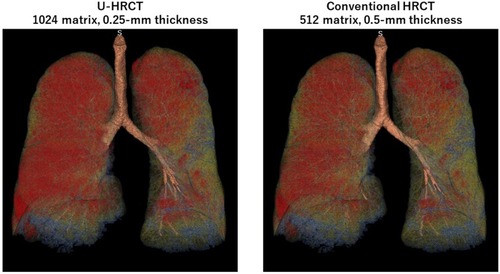
Figure 4 Comparison of the percentage of low attenuation volume (LAV%) on ultra-high-resolution CT (U-HRCT) and conventional HRCT scan modes using the threshold of −950 Hounsfield units. LAV% on HRCT scans tends to increase on U-HRCT scans.
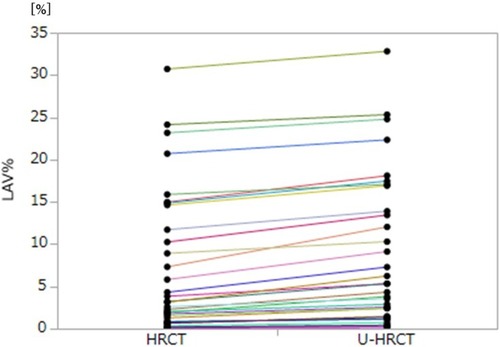
Table 3 Correlations Between Values For LAV% And Airflow Limitation
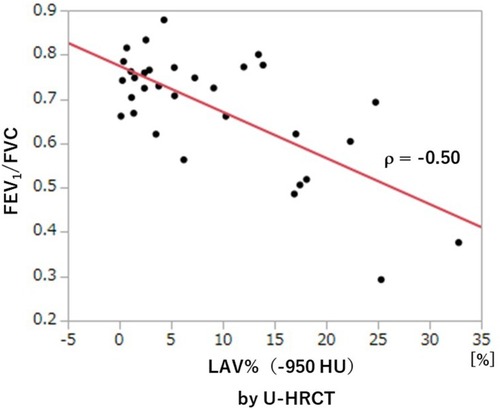
Figure 5 Correlation between FEV1/FVC and LAV%−950 (U-HRCT). A significant, negative correlation is observed between LAV%−950 and FEV1/FVC.