Figures & data
Table 1 Single and Combination DPI Groups Enrolled in the Study
Table 2 Patient Demographics and Clinical Characteristics (ITT Population and per Prescribed Inhaler at Study Entry)
Table 3 Percentage of Patients Making ≥1 Critical Error with their Prescribed DPI(s) at V1
Figure 1 Percentage of patients making ≥1 critical error with the primary DPI at V1. LAMA represents ELLIPTA UMEC or HandiHaler TIO.
Abbreviations: BUD, budesonide; DPI, dry-powder inhaler; FF, fluticasone furoate; FOR, formoterol; FP, fluticasone propionate; GLY, glycopyrronium; IND, indacaterol; LAMA, long-acting muscarinic antagonist; SAL, salmeterol; TIO, tiotropium; UMEC, umeclidinium; VI, vilanterol; V1, Visit 1.
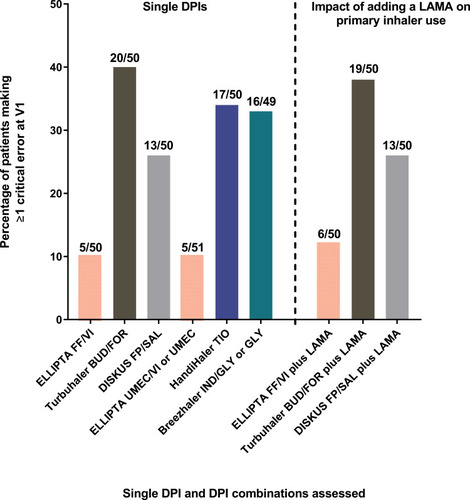
Table 4 Percentage of Patients Making ≥1 Critical Error with their Prescribed DPI(s) at V2
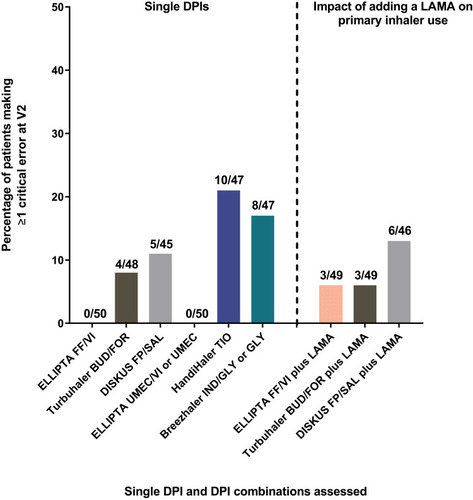
Figure 2 Percentage of patients making ≥1 critical error with the primary DPI at V2, 6 weeks after training. LAMA represents ELLIPTA UMEC or HandiHaler TIO.
Abbreviations: BUD, budesonide; DPI, dry-powder inhaler; FF, fluticasone furoate; FOR, formoterol; FP, fluticasone propionate; GLY, glycopyrronium; IND, indacaterol; LAMA, long-acting muscarinic antagonist; SAL, salmeterol; TIO, tiotropium; UMEC, umeclidinium; VI, vilanterol; V2, Visit 2.