
Figures & data
Table 1 Baseline Characteristics
Table 2 Assessments At Baseline
Figure 1 Flow chart.
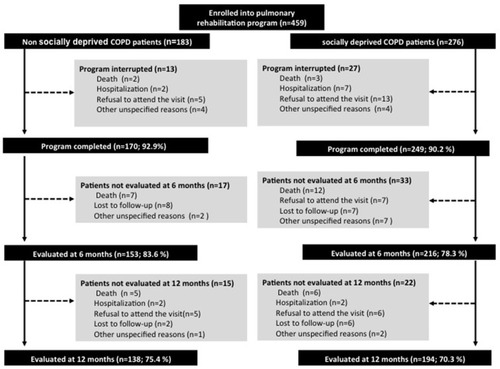
Figure 2 Changes in exercise tolerance, quality of life, anxiety, and depression in COPD patients according to socioeconomic status. (A–C) Changes in parameters from T0 (baseline) to T2, T8, and T14 (2, 8, and 14 months after T0) for (A) 6 min stepper test (6MST) stroke number, (B) Visual Simplified Respiratory Questionnaire (VSRQ) score, and (C) Hospital Anxiety and Depression Scale (HADS). Data are presented as the mean ± SD. *:Adjusted for baseline value, age, sex, living arrangement, smoking status, and forced vital capacity. P value represents pinteraction for the interaction between time and group (i.e., pinteraction <0.05 indicates a significant difference in the change in variable with time compared between the two patient groups). All analyses were adjusted to the baseline value.
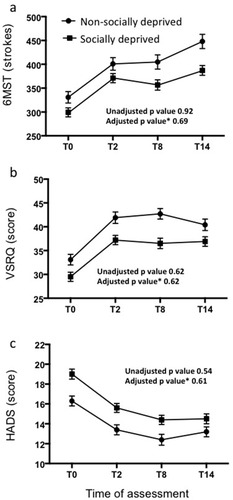
Table 3 Percentage Of PR Responders According To Socioeconomic Status