Figures & data
Table 1 Baseline Characteristics Of The Two Groups
Table 2 Impact Of Peak Oxygen Pulse (O2P) On Exercise Capacity
Table 3 Impact Of Peak Oxygen Pulse (O2P) On Circulatory Parameters
Table 4 Impact Of Peak Oxygen Pulse (O2P) On Ventilatory Parameters
Table 5 Impact Of Peak Oxygen Pulse (O2P) On Dyspnea Score And Health-Related Quality Of Life
Table 6 Impact Of Peak Oxygen Pulse (O2P) On The Number Of Hospitalizations And Emergency Room (ER) Visits In The Following Year After Enrollment
Figure 1 The simple linear regression between peak oxygen pulse (O2P) and anaerobic threshold (AT). The slant line is calculated using least square regression analysis. (p < 0.001; R2 = 0.566; Pearson’s r = 0.756).
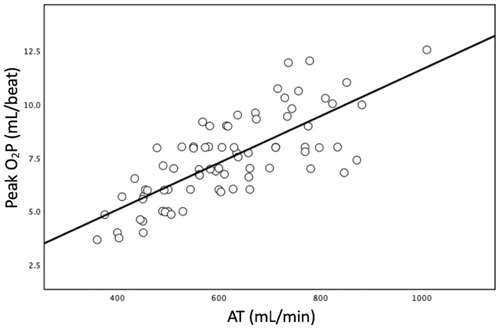
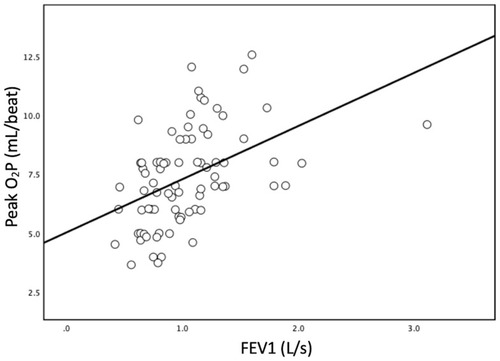
Figure 2 The simple linear regression between forced expiratory volume in one second (FEV1) and peak oxygen pulse (O2P). The slant line is calculated using least square regression analysis. (p < 0.001; R2 = 0.202; Pearson’s r = 0.461).