
Figures & data
Table 1 Patients’ Baseline Characteristics (N=16)
Figure 1 Trial profile. *The patient experiencing exertional arrhythmia during cardiopulmonary exercise testing (CPET) at 12 weeks underwent further follow-up examinations except for cardiopulmonary exercise testing.
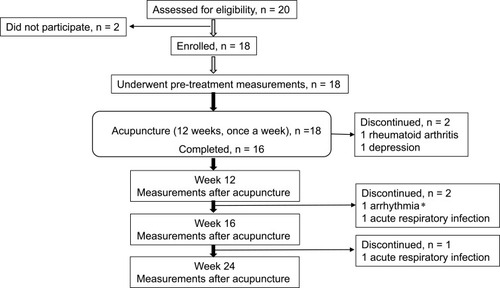
Table 2 Peak Parameters Of The Incremental Exercise Test After 12 Weeks Of Acupuncture Treatment And Follow-Up Data
Figure 2 Responses and follow-up data after 12 weeks of acupuncture treatment at maximum exercise in (A) incremental exercise testing (IET): 1) peak oxygen uptake and 2) peak minute ventilation. (B) Constant work rate exercise testing (CWRET): 1) endurance time, 2) oxygen uptake at terminated exercise, 3) DFO2 at terminated exercise, 4) Borg scale at isotime. Data are expressed as the mean ± standard error. O2: oxygen uptake;
E: minute ventilation; DFO2: inspired oxygen concentration (FiO2) - expired oxygen concentration (FeO2); p-values: time course effect of 12-week acupuncture treatment by one-way repeated measures analysis of variance; *p < 0.05, ***p < 0.001: pre-treatment vs 12 weeks, paired t-test.
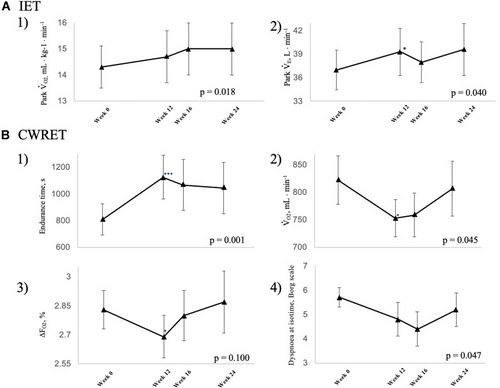
Table 3 Peak Parameters Of The Constant Work Rate Exercise Test After 12 Weeks Of Acupuncture Treatment And Follow-Up Data
Table 4 St George’s Respiratory Questionnaire Scores, Pulmonary Functions, And Other Parameters After 12 Weeks Of Acupuncture Treatment And Follow-Up Data
Figure 3 Increases in Borg scale scores, oxygen uptake (O2), and minute ventilation (
E) during constant work rate exercise testing (CWRET) between baseline and (weeks 12 or 16) with the strongest improvement in time to the limit of tolerance (tLIM). Data are expressed as mean ± standard error. Closed dots indicate baseline values, and open dots indicate the values of the week with the most improved tLIM. There was a significant improvement in the 1) Borg scale scores and decrease in 2)
O2 and 3)
E throughout the CWRET. The p-values between pre- and post-acupuncture values in each stage were shown in 4) as Table.
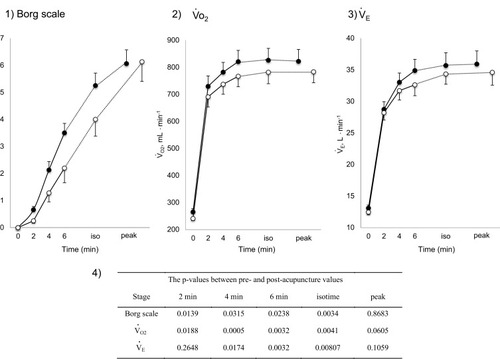
Table 5 Improvement In Time To The Limit Of Tolerance In Constant Workload Exercise Testing And Related Parameters In Each Patient
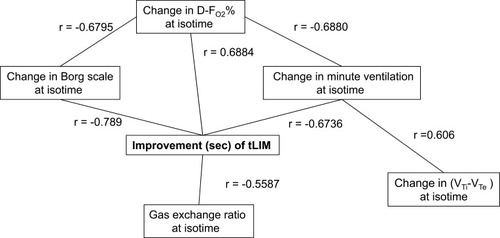
Figure 4 Relationships between Improvement in time to the limit of tolerance and parameters at isotime in constant work rate exercise testing (CWRET).
Data Availability
The authors confirm that the data supporting the findings of this study are available within the article.