Figures & data
Table 1 Baseline Characteristics of the Study Participants
Figure 1 (A) Absolute and adjusted hand-grip strength for age, smoking status, waist circumference, anemia, hypertension and serum HDL-C in subjects with non-COPD and COPD by GOLD grades. Values are expressed as mean ± SD; one-way analysis of variance. * p < 0.05 vs women participants of the same group, # p < 0.05 vs non-COPD participants of the same gender. Relationship of the FEV1% with the absolute (B) and adjusted hand-grip strength (C) in the men and women participants with and without COPD.
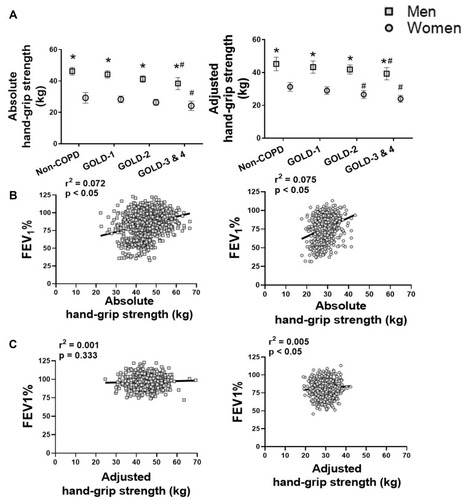
Figure 2 (A) Hand-grip strength according to smoking status in the men and women participants of different age groups; Values are expressed as mean ± SD; one-way analysis of variance. * p < 0.05 vs 66–75 old participants of the same gender, # p < 0.05 vs non-smokers of the same gender and age group. (B) relationship of the serum HDL-C with the hand-grip strength and (C) FEV1% in men and women participants of the non-COPD and COPD groups. Hand-grip strength was adjusted for age, smoking status, waist circumference, anemia and hypertension in all analyses.
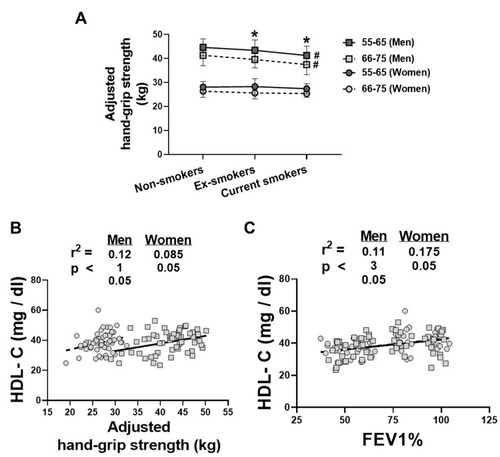
Table 2 Classification of the COPD Participants According to EQ-5D Scores and Association with Hand-Grip Strength and FEV1%
Table 3 Protein Expression of the Serum Biomarkers of TSA, AGP, CC16 and HDL-C in the Sera of Participants with and Without COPD
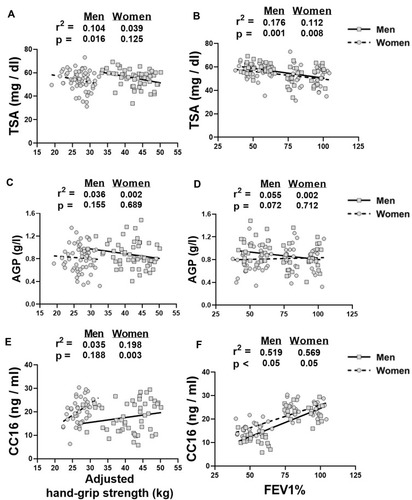
Figure 3 Linear regression graphs of the hand-grip strength and FEV1% with serum biomarkers of TSA (A, B), AGP (C, D) and CC16 (E, F) in the men and women participants with and without COPD. Hand-grip strength was adjusted for age, smoking status, waist circumference, anemia and hypertension in all analyses.