Figures & data
Table 1 Patient Characteristics
Table 2 The Comparison of the Dysphagia Screening Results Between the Two Groups
Figure 1 Results of an ROC curve analysis using the swallow frequency in RSST. When the RSST cut-off value was set at 5.0, the sensitivity and specificity were 0.429 and 0.964, respectively, and the area under the ROC curve was 0.775.
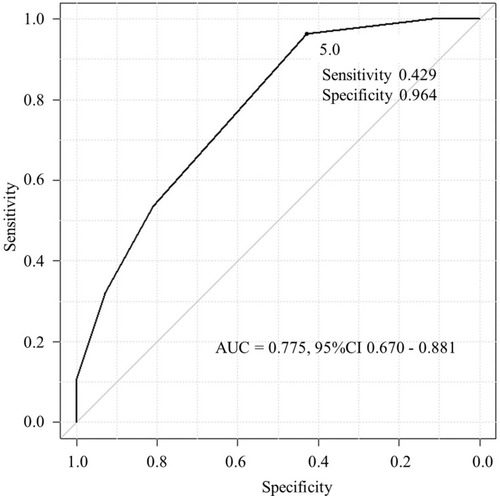
Figure 2 Kaplan-Meier curves of the time to first exacerbation (any severity) (A) stratified by the presence of exacerbation in the past year and (B) stratified by the RSST cut-off value of 5. The time to first exacerbation was significantly longer in patients with a history of exacerbation in the past year than in those with no such history (A) and in those with an RSST value of >5 (B). The RSST was a stronger predictor of exacerbation than a history of exacerbation.
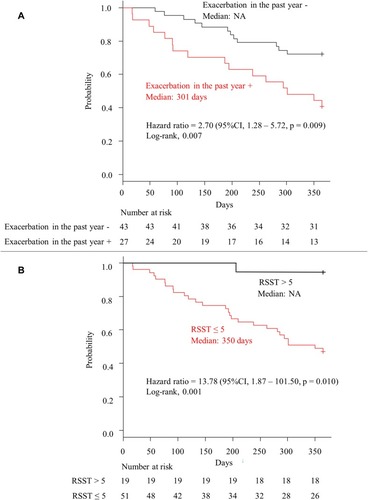
Figure 3 Kaplan-Meier curves of the time to first moderate or severe exacerbation (A) stratified by the presence of exacerbation in the past year and (B) stratified by the RSST cut-off value of 5. The time to first moderate or severe exacerbation was significantly longer in patients with a history of exacerbation in the past year than in those with no such history (A) and in those with an RSST value of >5 (B). The RSST was a stronger predictor of exacerbation than a history of exacerbation. This difference was more pronounced when the time to first moderate or severe exacerbation was set as an event.
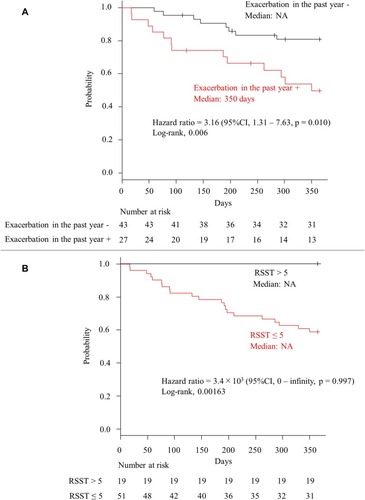
Table 3 The Relationship Between a History of Exacerbation in the Past Year and the Results of the RSST Using a Cut-Off Value of 5
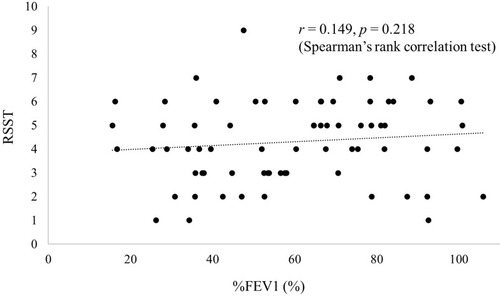
Figure 4 Correlation between the %FEV1 and the number of swallows in the RSST. No significant relationship was detected between the %FEV1 and the number of swallows in the RSST.