Figures & data
Figure 1 Changes in body weight and serum irisin concentration.
Notes: (A) Body weight changes of mice. Values are presented as the mean ± SD. (B) Serum irisin concentration in the exercise + smoking group were significantly higher than in the control and smoking groups. *P<0.05.
Abbreviation: SD, standard deviation.
Abbreviation: SD, standard deviation.
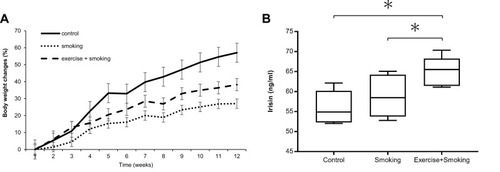
Figure 2 Nrf2 and HO-1 expression in the lung homogenate.
Notes: (A) Nrf2 mRNA expression in mice from the exercise + smoking group was significantly increased compared to expression in mice from the control and smoking groups. (B–D) Nrf2 and HO-1 protein expression in mice from the exercise + smoking group were significantly increased compared to expression in mice from the control and smoking groups. Western blot analysis of Nrf2 and HO-1 were normalized to β-actin and measured by densitometry. *P<0.05.
Abbreviations: Nrf2, nuclear factor erythroid 2-related factor 2; HO-1, heme oxygenase-1.
Abbreviations: Nrf2, nuclear factor erythroid 2-related factor 2; HO-1, heme oxygenase-1.
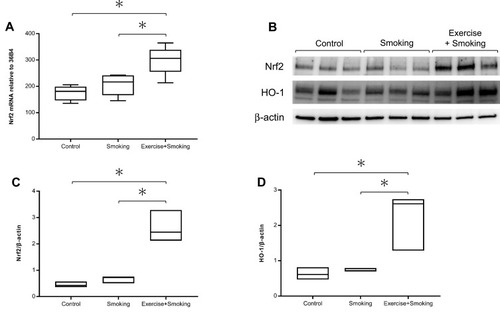
Figure 3 Total cell count and proportion of neutrophils in the BALF.
Notes: (A) Representative images of the BALF from each group are shown at 200x magnification. (B and C) The proportion of neutrophils in the BALF was attenuated in mice from the exercise + smoking group compared to mice in the smoking group; however, the number of total cells was not attenuated. Values are presented as the mean ± SD. *P<0.05.
Abbreviations: BALF, bronchoalveolar lavage fluid; SD, standard deviation.
Abbreviations: BALF, bronchoalveolar lavage fluid; SD, standard deviation.
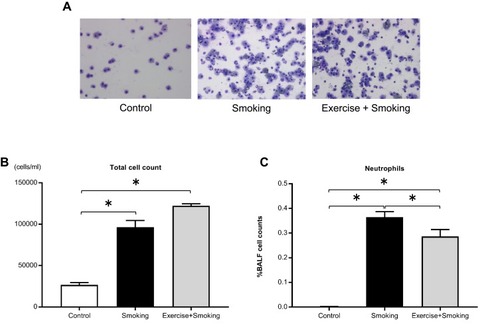
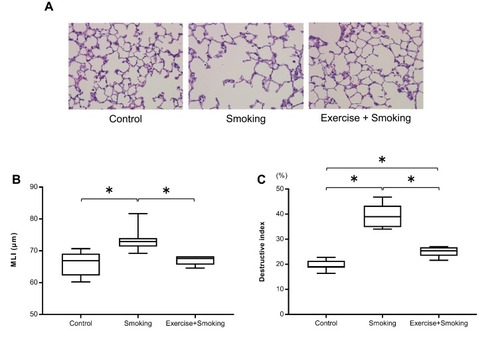
Figure 4 MLI and destructive index for the mice from each group.
Notes: (A) Representative histologic images, stained with hematoxylin-eosin, of lung sections from each group are shown at 200x magnification. (B) The MLI was significantly larger in mice from the smoking group than mice in the control group while the MLI was significantly smaller in mice from the exercise + smoking group than mice in the smoking group. The difference in MLI was not significant between the control and exercise + smoking groups. (C) The destructive index was significantly larger in mice from the smoking group than in mice from the control group. The destructive index was attenuated in mice from the exercise + smoking group compared to mice from the smoking group. *P<0.05.
Abbreviation: MLI, mean linear intercept.
Abbreviation: MLI, mean linear intercept.