
Figures & data
Table 1 Comparisons of Characteristics Among Four Computed Tomography-Based Phenotypes in 435 Patients with Chronic Obstructive Pulmonary Disease
Table 2 Comparison of Mortality Risk Between the Different Types (Log Rank Test)
Figure 1 Overall survival was compared between the four CT-defined phenotypes. Kaplan–Meier curve analyses indicated significant differences among groups (P=0.002).
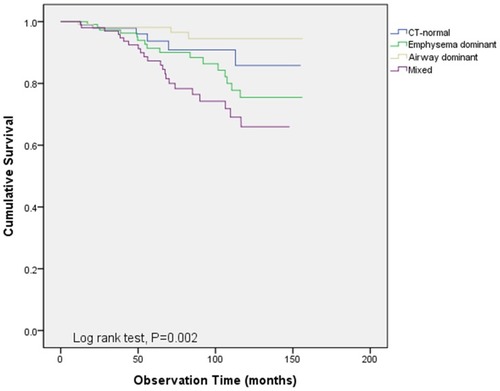
Table 3 Association of Patient Factors with Severe Exacerbations Frequency During 1st Post-enrolment Year