Figures & data
Table 1 Baseline Characteristics of Patients Acutely Hospitalized with Prevalent COPD
Table 2 Causes of Index Admission and 365-Day Readmission in 4022 Patients with Prevalent COPD
Table 3 Rates of Readmission and Mortality Within 365 Days in 4022 Patients with COPD Following Hospitalization Stratified by suPAR Quartiles or Blood Eosinophil Counts
Figure 1 Cumulative incidence plot of mortality (top) and readmission (bottom) within 365 days, stratified by quartiles of suPAR, for 4022 patients acutely admitted with chronic obstructive pulmonary disease.
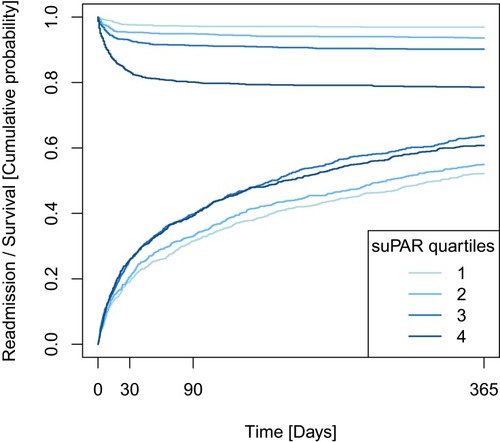
Table 4 HRs for Readmission and Mortality Within 365 Days Following Hospitalization in Patients with COPD (n=4022), for Continuous suPAR (Log2-Transformed) or Stratified by suPAR Quartiles
Table 5 HRs for Readmission and Mortality Within 365 Days Following Hospitalization in Patients with COPD (n=3849), for Continuous Blood Eosinophil Count (Log2-Transformed) or Stratified by Low, Intermediate, and High Blood Eosinophil Count
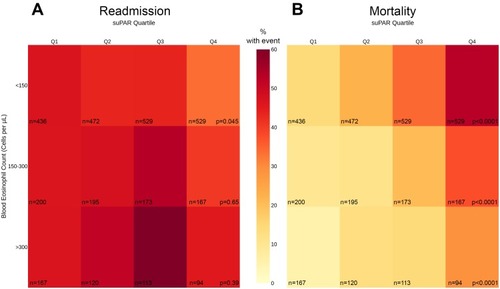
Figure 2 Heatmap of 365-days all-cause readmission (A) and mortality (B) events in 3849 patients with chronic obstructive pulmonary disease acutely admitted to a hospital, stratified by suPAR and blood eosinophil count on admission. Colors in the figure represent the percentage of patients with an event and the numbers represent the total number of patients in strata. P-values represent Chi2-tests by suPAR quartile after stratification for blood eosinophil count, versus event-free patients.