Figures & data
Figure 1 Process of patient selection in this study. Only data from COPD patients with spirometrically confirmed COPD (FEV1/FVC < 0.7), as well as CT and echocardiography measurements at baseline, were selected and analyzed.
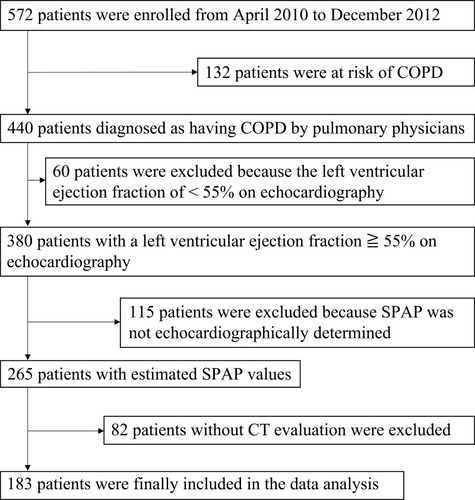
Table 1 Baseline Characteristics of the Study Population
Figure 2 Distribution of eSPAP in the study population with PH assessed by echocardiography. Shaded bars indicate patients with PH.
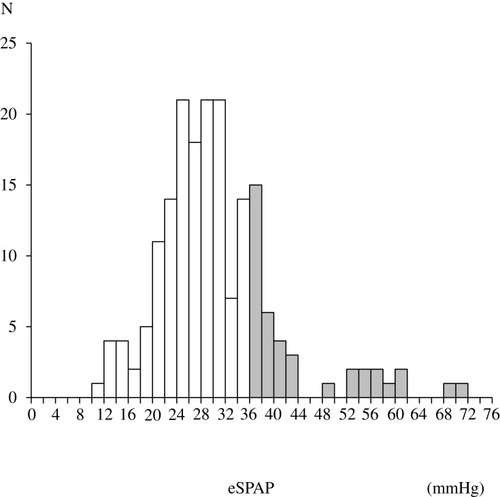
Table 2 Comparison of the Characteristics Stratified by the Presence of PH
Figure 3 Association of PH assessed by echocardiography and health status in COPD patients. (A) Comparison of baseline CAT scores between the two groups. (B–E) Comparison of baseline SGRQ scores between the two groups. Data were compared between groups using the Mann–Whitney U-test.
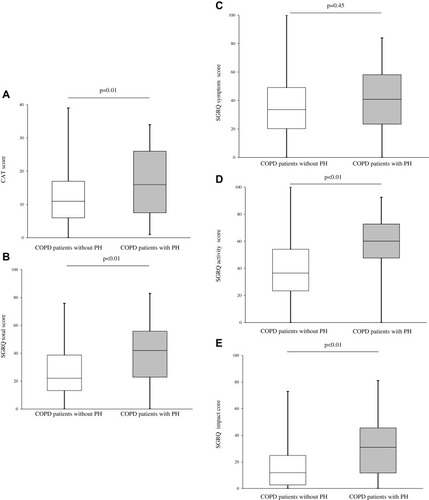
Table 3 Comparison of Lung Function Parameters Between COPD Patients with and Without PH
Figure 4 Relationship between PH assessed by echocardiography and lung diffusion capacity. (A) Correlation between eSPAP and %DLCO in COPD patients. (B) ROC curves of %DLCO for the prediction of PH assessed by echocardiography. Correlations between continuous variables were evaluated using Spearman’s rank correlation coefficient.
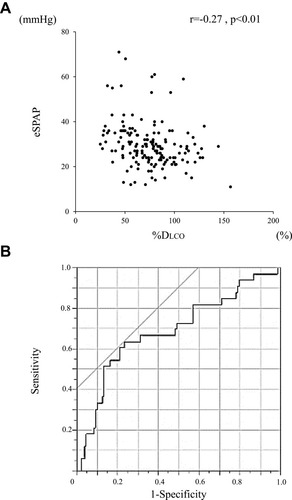
Table 4 Predictors for the Presence of PH According to Multivariate Logistic Regression Analysis
Figure 5 Relationship between PH assessed by echocardiography and baseline chest CT abnormalities in COPD patients. (A) Comparison of LAA% between the two groups. (B) Frequencies of emphysema severities in the two groups. (C) Comparison of WA% between the two groups. (D) Frequencies of interstitial abnormalities in the two groups. Data were compared between groups using the Mann–Whitney U-test and χ2 test.
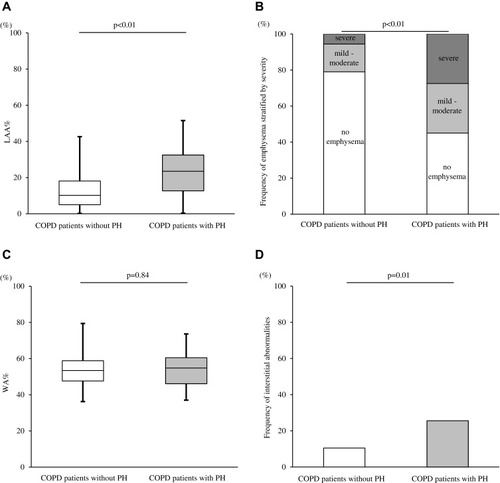
Figure 6 Relationship between PH assessed by echocardiography and ratio of pulmonary artery diameter to aortic artery diameter. (A) Correlation between eSPAP and PA/Ao in COPD patients. (B) ROC curves of PA/Ao for the prediction of PH assessed by echocardiography. Correlations between continuous variables were evaluated using Spearman’s rank correlation coefficient.
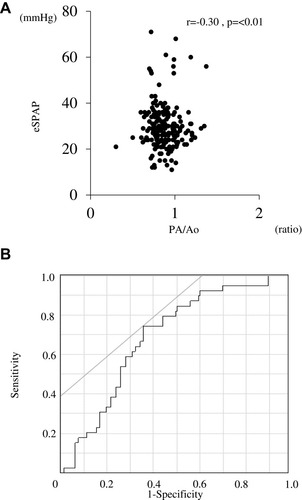
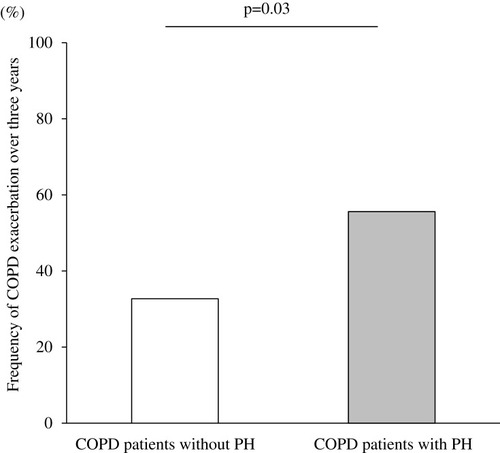
Figure 7 Frequency of COPD exacerbations over three years according to the presence or absence of PH assessed by echocardiography. Data were compared between groups using χ2 test.