Figures & data
Table 1 The Number of Hospital Admissions Due to Asthma, COPD, and Bronchiectasis in Population Subgroups and Descriptive Statistics of Air Pollutants and Meteorological Parameters in Ahvaz City, 2008–2018
Table 2 Correlation Coefficients Between Air Pollutants and Meteorological Parameters in Ahvaz, Between 2008 and 2018
Table 3 The Relative Risk (95% CIs) of Asthma Admissions with an Increase of 10 µg/M3 in PM2.5, NO, NO2 and SO2 According to Single Lag, Adjusted Unconstrained and Constrained DLM Modelsa
Table 4 The Relative Risk (95% CIs) of COPD Admissions with an Increase of 10 µg/M3 in PM2.5, NO, NO2, and CO According to Single Lag, Adjusted Unconstrained and Constrained DLM Modelsa
Table 5 The Relative Risk (95% CIs) of Bronchiectasis Admissions with an Increase of 10 µg/M3 in PM10, so, and CO According to Single Lag, Adjusted Unconstrained and Constrained DLM Modelsa
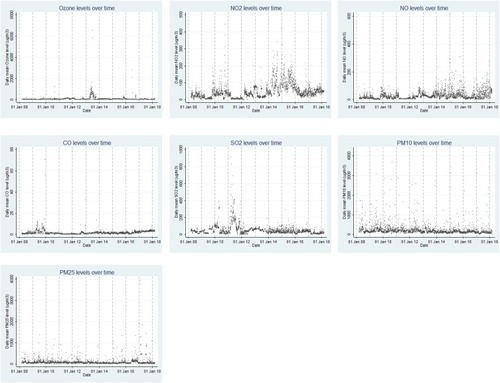
Figure 1 The average daily concentration of O3, NO2, NO, CO, SO2, PM10 and PM2.5 during the study period.