
Figures & data
Figure 1 Flowchart diagram of this study.
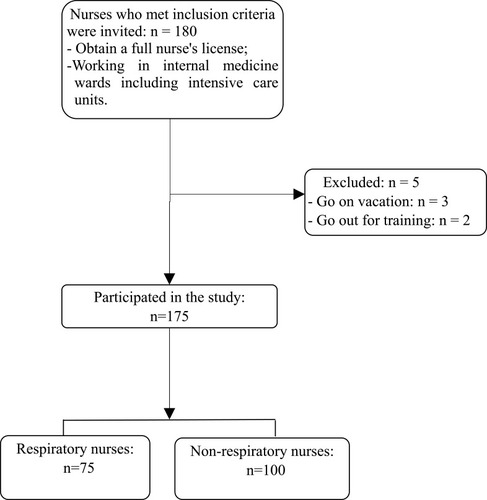
Table 1 Basic Socio Demographic Characteristics for Two Populations (n=175)
Table 2 Overall BCKQ Scores and Scores for Each Topic in Two Populations (n=175)
Figure 2 Distribution of overall BCKQ scores in two populations (n=175). **p < 0.01.
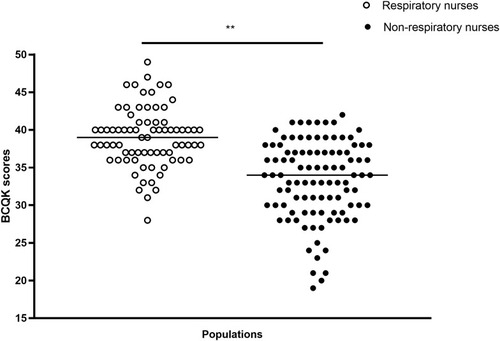
Table 3 Percentages of Participants in Respiratory Nurses (Non-Respiratory Nurses) Giving a Correct Response for All 65 Items Indexed by 13 Topics and Their Five Items (a, b, c, d, e) (n=175)
Figure 3 Overall BCKQ scores and the total hospitalization length (days) of all COPD patients in 2018 for each specialist respiratory ward. (A) Overall BCKQ scores of nurses for each specialist respiratory ward (n = 75). (B) Total hospitalization length (days) of all COPD patients in 2018 for each specialist respiratory ward.
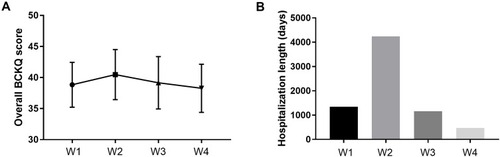
Table 4 Linear Regression Coefficients (β) of Potential Factors Related to BCKQ Score in Internal Medicine Nurses
Table 5 Comparison of Basic Socio Demographic Characteristics Between Subgroups in Respiratory Nurses (n=75)
Table 6 Comparison of Basic Socio Demographic Characteristics Between Subgroups in Non-Respiratory Nurses (n=100)