
Figures & data
Table 1 Participants’ Spirometric and Anthropometric Characteristics
Figure 1 Flowchart of the selection of the study population.
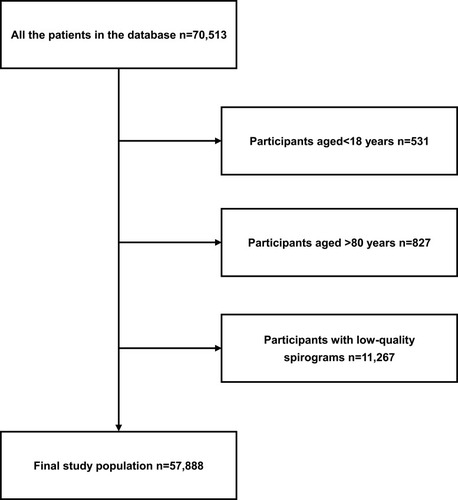
Table 2 The Comparison Between Zhongshan-2011 and GLI-2012 Reference Values
Figure 2 Bland-Altman spot of LLN and predicted values of GLI-2012 and Zhongshan-2011.
Abbreviations: Δ, difference of GLI-2012 data minus Zhongshan-2011 data; FEV1, forced expiratory volume in 1 s; FVC, forced vital capacity; GLI-2012, Global Lung Function Initiative 2012 equations; LLN, lower limits of normal.
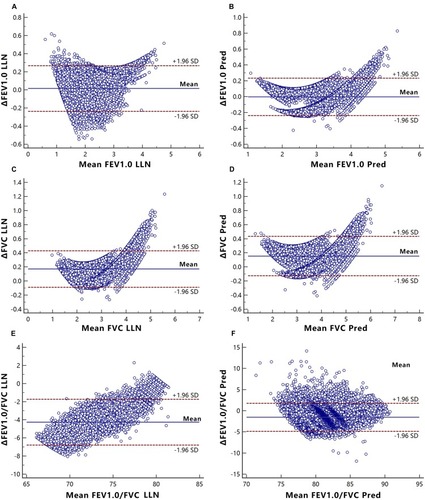
Table 3 The Influence of Diagnostic Criteria and Reference Equations on the Frequency of Airway Obstruction
Table 4 Numbers of Concordant and Discordant Pairs When Using FEV1/FVC<LLN as Diagnostic Criterion Between GLI-2012 and Zhongshan-2011 to Diagnose Airway Obstruction
Table 5 Numbers of Concordant and Discordant Pairs When Using FEV1/FVC<92% Pred as Diagnostic Criterion Between GLI-2012 and Zhongshan-2011 to Diagnose Airway Obstruction