Figures & data
Figure 1 Example of a computed tomography slice before (Panel A) and after segmentation (Panel B).
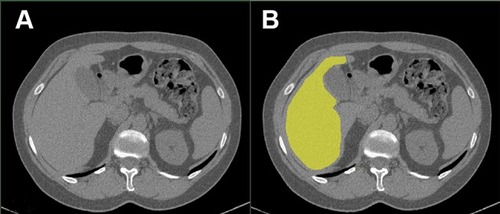
Table 1 Characteristics of Patients with COPD and Control Subjects
Figure 2 Liver attenuation distribution among patients with COPD and control subjects. p>0.05 for all comparisons.
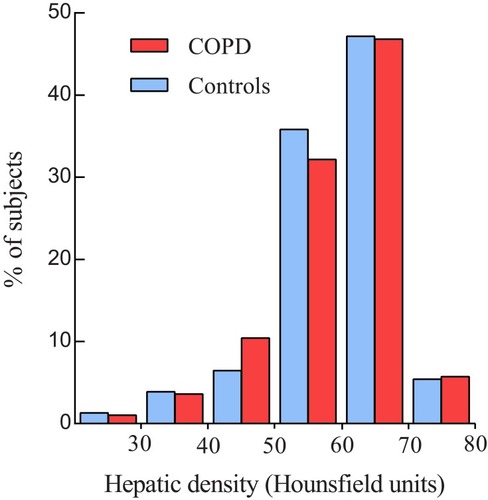
Table 2 Characteristics of COPD Patients by Liver Attenuation Quartile
Figure 3 Unadjusted and adjusted odds ratios to present cardiovascular comorbidity in the lowest liver density quartile vs the highest liver density quartile.
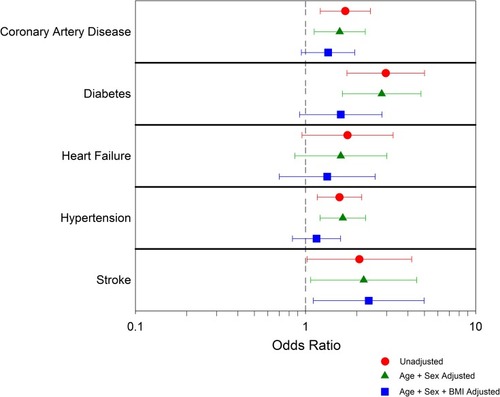
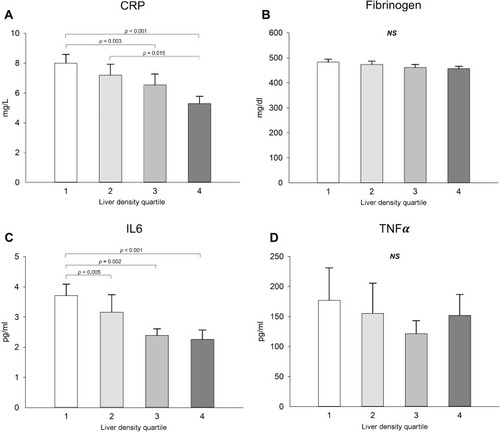
Figure 4 Inflammatory marker levels showing differences according to liver attenuation groups (A-D). Values are expressed with mean ± standard errors. 1 is the group with the lowest liver attenuation and 4 the group with the greatest liver attenuation. p-value for ANCOVA corrected for age, sex, Body Mass Index and smoking status.