Figures & data
Table 1 Baseline Characteristic of Study Population
Figure 1 Study flow chart. SPIROMICS: Subpopulations and Intermediate Outcome Measures in COPD Study.
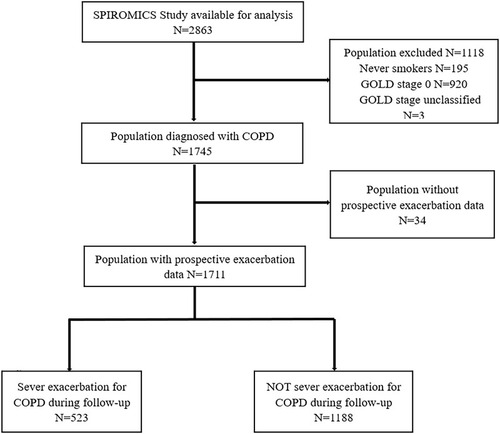
Table 2 Identified Predictors of Severe Exacerbations from Cox Proportional Hazards Model, N=1438
Figure 2 A nomogram to predict the risk of severe exacerbations in stable COPD patients. To use the nomogram, draw a vertical line to identify corresponding points of each variable according to their actual status. Then sum up the points of all variables and find the position on the total points axis. With the same line mentioned above, you can determine the risk of severe exacerbations of 3- and 5-year at the lower line of the nomogram. Comorbidity index is identified through counting the number of comorbid diseases one had among congestive heart failure, GERD, diabetes, and asthma.
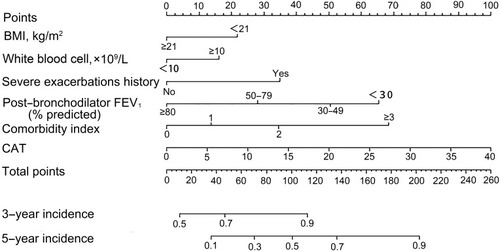
Table 3 C-Index of Nomogram, ADO, BODE and DOSE Risk Scores
Figure 3 Calibration plot showing predicted probability of severe exacerbations against the observed proportion of outcomes. The dashed line is the ideal calibration line. Vertical lines in grouped observation represents 95%CI. All groups of predicted probabilities fitting close to the ideal calibration line show perfect calibration. (A) 3-year incidence; (B) 5-year incidence.
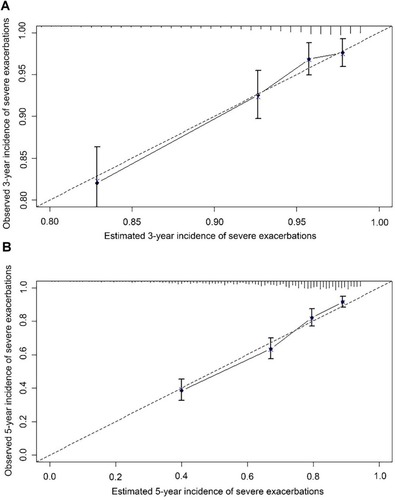
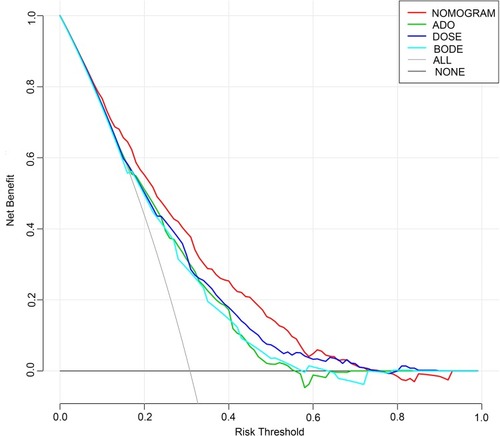
Figure 4 Decision curves.