Figures & data
Figure 1 Flow chart of participant selection in this study.
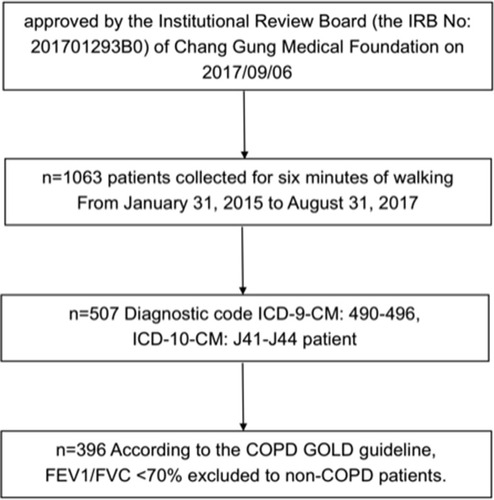
Table 1 Baseline Characteristics of COPD Patients Included in the Study (n=396)
Figure 2 Line of positive correlation between BODE quartiles and Charlson comorbidity index (p < 0.001).
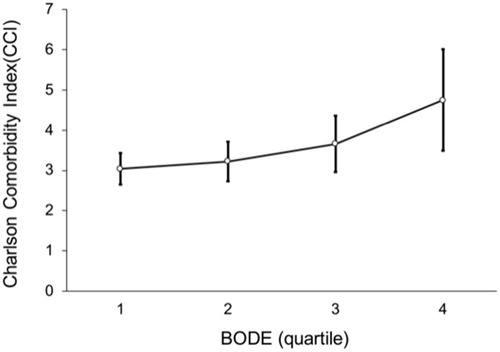
Figure 3 Hospitalization expenses by BODE quartiles for the high CCI and low CCI groups. Patients with high CCI level had higher hospitalization expenses than those with low CCI level after adjusting for BODE quartiles (p < 0.001).
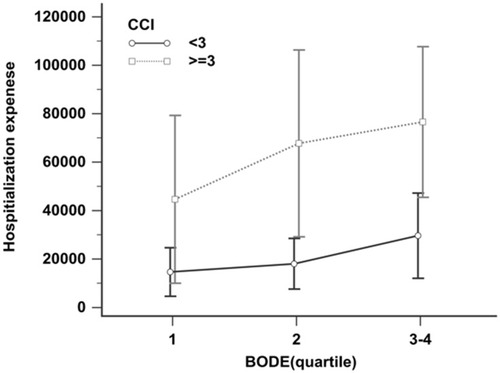
Figure 4 Non-linear trend of number of outpatient visits by BODE quartiles (p = 0.462).
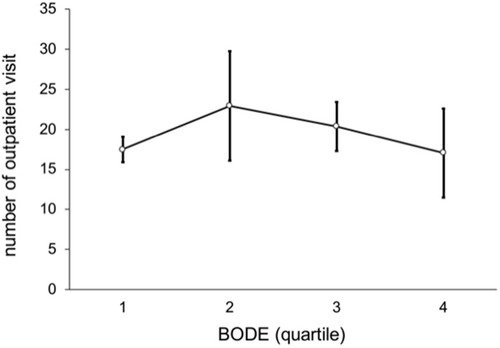
Figure 5 Linear trend of number of hospitalizations by BODE quartile (p < 0.001).
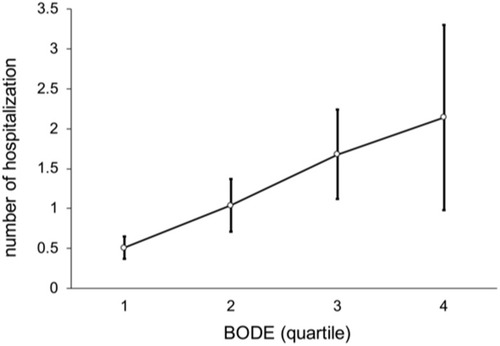
Figure 6 Linear trend of length of hospital stay by BODE quartile (p < 0.001).
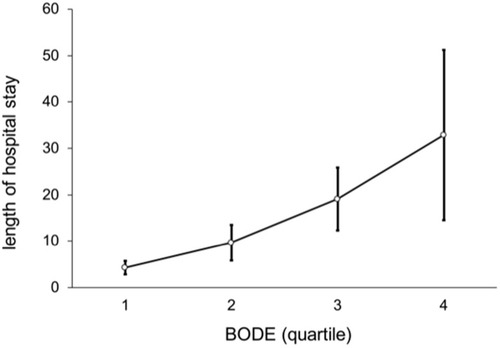
Figure 7 Non-linear trend of outpatient expenses by BODE quartile (p = 0.532).
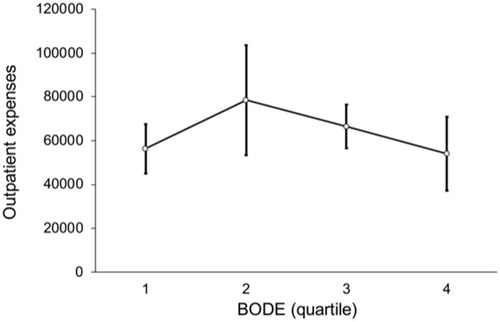
Figure 8 Relation between BODE quartiles and hospitalization. Overall p-value is marginally significant (p = 0.047) after multiple comparisons.
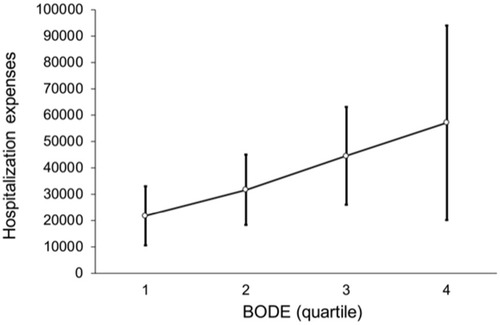
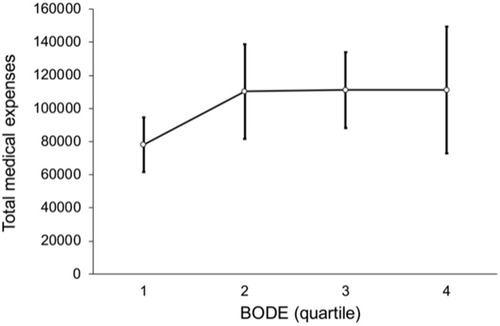
Figure 9 This shows linear trend among BODE quartiles with total medical expenses (p = 0.024).