Figures & data
Figure 1 Mouse lung function and histology of lung tissue. (A) Total lung capacity (TLC) and (B) airway resistance (R) were measured in mice (n=6). (C–D) Histology of lung tissue of mice from each group by hematoxylin and eosin staining. Arrows indicate inflammatory cell infiltration. Scale bar=50 µm. Representative (E) destructive index (DI) and (F) average linear intercept (Lm) of alveoli were assessed. Data presented as mean ± SD (n=6 per group). * P<0.05.
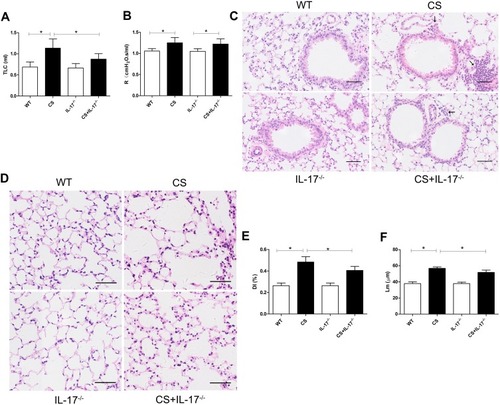
Figure 2 Deletion of IL-17A had a protective effect on bone mass of CS-exposed mice. (A) Representative microCT image reconstruction of trabecular bones (upper) and cortical bones (lower) towards the distal side of the femur. (B) Quantitative analysis of BMD of cortical bone and (C) trabecular bone. Quantitative analysis of trabecular parameters including (D) trabecular thickness (Tb.Th), (E) bone volume density (BV/TV), (F) trabecular spacing (Tb.sp), (G) structural model index (SMI). Data presented as mean ± SD (n=6 per group). * P<0.05.
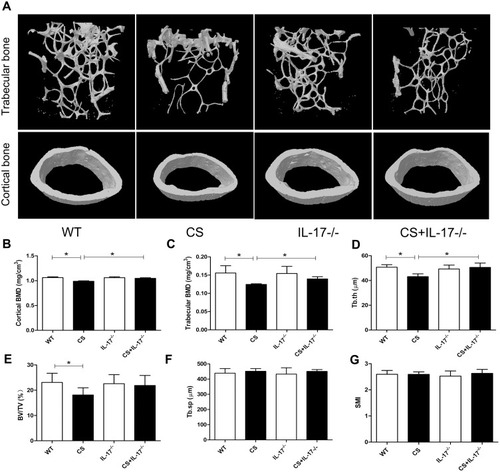
Figure 3 TRAP staining and RANKL expression in femur sections. (A) TRAP staining (upper) and immunohistochemical staining of RANKL expression (lower) in bone along the distal femur. TRAP-positive osteoclasts are stained red purple on the surface of bone. Scale bar=100 µm. Brown cells are RANKL expression positive cells. Magnification ×200. Scale bar=50 µm. (B) Numbers of TRAP-positive osteoclasts on the bone surface, measured as cells per millimeter of perimeter(/B.Pm). (C) Quantitative analysis of RANKL-positive cells per bone marrow area (mm2), Data presented as mean ± SD (n=5 per group). * P<0.05.
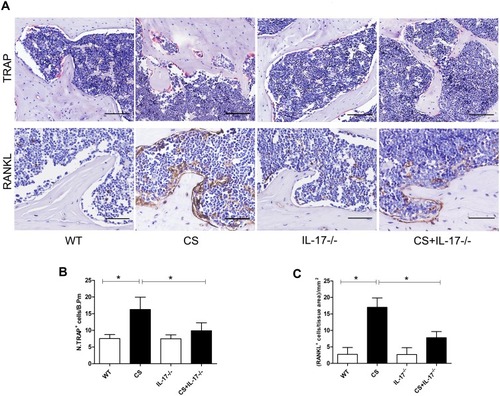
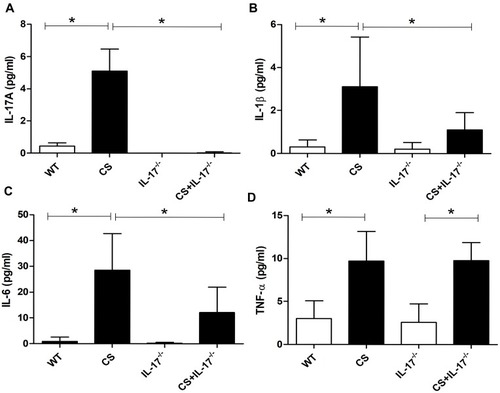
Figure 4 Concentration of IL-17A, IL-1β, IL-6, and TNF-α in serum. Levels of serum (A) IL-17A, (B) IL-1β, (C) IL-6 and (D) TNF-α were determined by Procarta cytokine profiling assay or enzyme-linked immunosorbent assay (ELISA). Data presented as mean ± SD (n=6 per group). * P<0.05.