Figures & data
Figure 1 Plasma concentration of immunoglobulins in 262 patients with COPD stage II–IV. Black lines indicate mean and 95% CI, dotted line indicates upper and lower reference values. Numbers in graph indicate percentage of patients with values below reference.
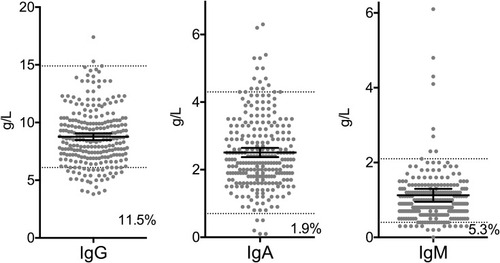
Table 1 Patient Descriptives
Table 2 MMRC Scale
Table 3 Clinical Presentation and Treatment of COPD
Figure 2 Acute exacerbations of COPD in hypogamma-COPD vs normal-IgG-COPD. Black dots: COPD patients with IgG <6.1 g/L, grey dots: COPD patients with normal IgG levels. Black lines indicate median and interquartile range. *Indicates significant difference (p<0.0001, Mann–Whitney test). Hospital adm., hospital admissions; Steroid tr., oral steroid treatments; Antibiotic tr., antibiotic treatments.
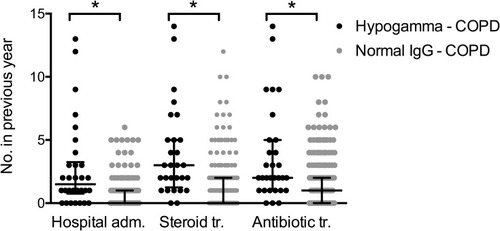
Figure 3 COPD admissions in previous year by serum IgG levels. There was a significant non-parametric correlation between number of COPD admissions in the previous year (the year preceding inclusion) and the serum levels of IgG measured upon inclusion (Spearman's test p<0.0001).
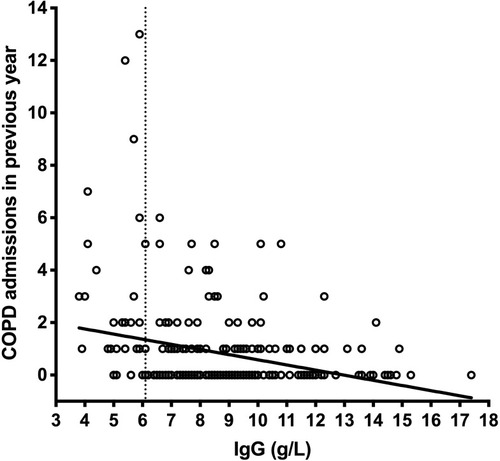
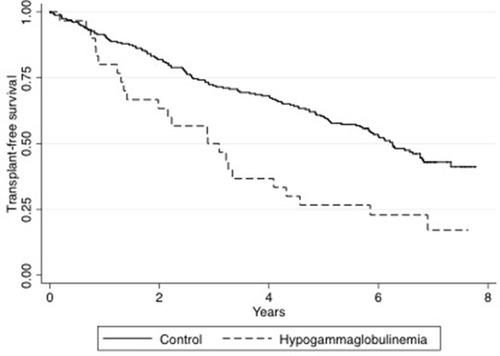
Figure 4 Survival after inclusion in hypogamma-COPD vs normal-IgG-COPD. The Kaplan–Meyer plot shows transplant-free survival of all included patients from time of inclusion to five years after inclusion of the last patient. Black line: normal-IgG-COPD. Dotted line: hypogamma-COPD. Survival compared using Log-rank test (p=0.0003).