Figures & data
Table 1 Patient Characteristics by ADI Quintile
Figure 1 Distribution of ADI national rank by covariate levels. For continuous covariates (age, BMI, FEV1% predicted, pack years), the variables were dichotomized in the way it is described in the legends.
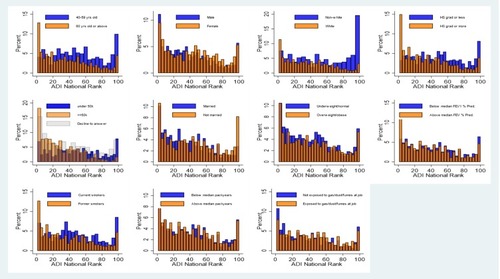
Table 2 Regression of COPD-Related Outcomes on Quintile ADI
Figure 2 Average predicted difference between top and bottom quantile ADI national rank: the most-disadvantaged vs the least-disadvantaged neighborhoods. *Six-minute walk was rescaled by a factor of one-tenth (e.g., the value −2 meters indicates −20 meters). #For exacerbation variables only, Y-axis indicates the rate ratio (e.g., the value of 2 would indicate the rate of exacerbation that is twice as great for the most disadvantaged neighborhood than that for the least disadvantaged).
Notes: Y-axis represents the regression coefficient for the most-disadvantaged 20th percentile (with the least-disadvantaged 20th percentile as the reference category) in the fully adjusted regression of outcomes on quintile ADI.
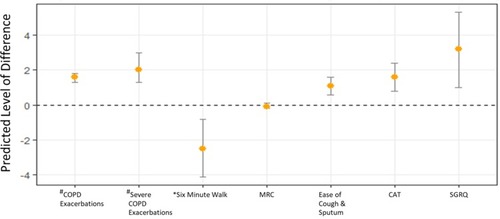
Table 3 Regression of COPD-Related Outcomes on Continuous ADI
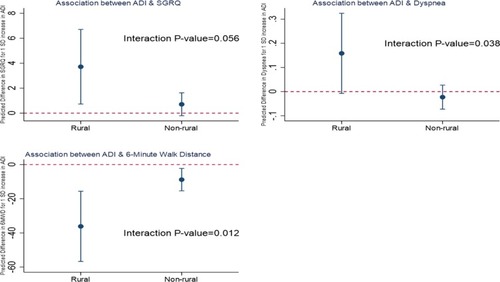
Figure 3 Association of continuous ADI and COPD-related outcomes by rural status. The charts illustrate the interactions between continuous ADI and rural status on their associations with SGRQ, dyspnea, and 6-minute walk distance. The y-axis represents the predicted difference in outcome for one SD increase in ADI based on the fully adjusted regression model adjusting for age, sex, education, income, marital status, BMI, FEV1% predicted, smoking status, pack years, and occupational exposure.