
Figures & data
Figure 1 Flow chart for the selection of the study population. A total of 1282 patients with suspected COPD were considered eligible. Of these, 453 patients without PFT results, history of asthma, and not COPD were excluded. Then, 73 patients with known chronic liver diseases were further excluded. Finally, 756 patients with COPD were selected for the statistical analysis.
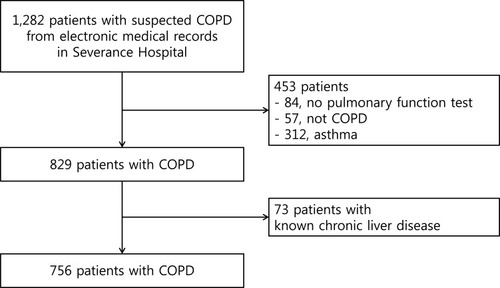
Table 1 Baseline Characteristics at the Time of COPD Diagnosis (n=756)
Table 2 Comparison Between Survivors and Non-Survivors
Table 3 Multivariate Cox Hazard Model to Identify Independent Predictors of All-Cause Mortality
Figure 2 The cumulative survival rate according to FIB-4. When the study population was stratified into three risk groups (low [Q1], intermediate [Q2-3], and high [Q4] FIB-4 groups), the high FIB-4 (>1.57) group had a significantly lower cumulative survival rate than the low FIB-4 (≤1.05) group (P=0.031, Log-rank test).
![Figure 2 The cumulative survival rate according to FIB-4. When the study population was stratified into three risk groups (low [Q1], intermediate [Q2-3], and high [Q4] FIB-4 groups), the high FIB-4 (>1.57) group had a significantly lower cumulative survival rate than the low FIB-4 (≤1.05) group (P=0.031, Log-rank test).](/cms/asset/28a2af46-7697-41ed-b532-2839ba5f694d/dcop_a_12198181_f0002_b.jpg)
Table 4 Multivariate Regression Analysis for the Relationship Between FIB-4 and Acute Exacerbation