
Figures & data
Table 1 Baseline Demographics of Holter ECG Subgroups (1222.11, 1222.12, 1222.13 and 1222.14)
Figure 1 Shifts in SVPB: olodaterol and formoterol vs placebo at (A) Week 12, (B) Week 24, (C) Week 40 and (D) Week 48.
P-values for overall differences between category of change and category of treatment calculated by Chi-squared frequency tests; Numbers above the bars are % of patients whereas numbers within the bars are number of patients.
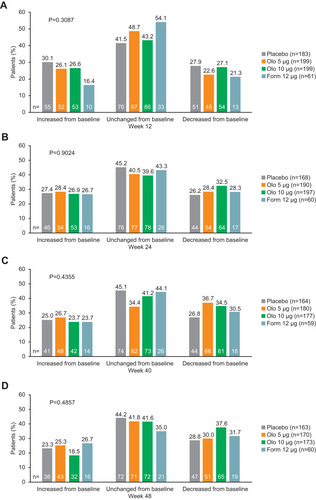
Figure 2 Shifts in VPB: olodaterol and formoterol vs placebo at (A) Week 12, (B) Week 24, (C) Week 40 and (D) Week 48.
P-values for overall differences between category of change and category of treatment calculated by Chi-squared frequency tests; Numbers above the bars are % of patients whereas numbers within the bars are number of patients.
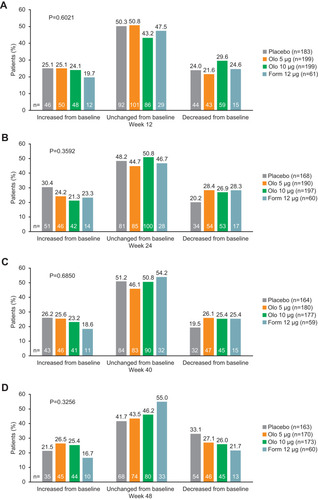
Figure 3 Unadjusted baseline heart rate (A) and adjusted mean change in heart rate from baseline (B): olodaterol and formoterol vs placebo during treatment. *P<0.05. P-values are for adjusted mean change from baseline.
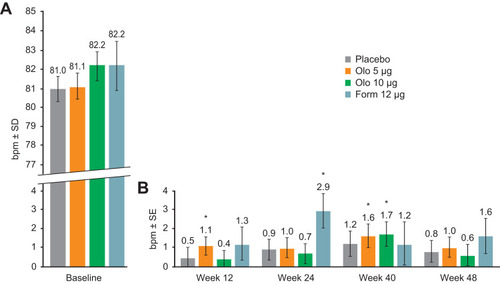
Table 2 Adverse Events of Holter ECG Subgroups